By Elizabeth Costa - Top Real Estate Agent in Doral, Florida | The Keyes Company
15+ years of experience · 300+ closed transactions · Bilingual: English & Spanish
How is the Doral real estate market performing in Q2 2026?
Q2 2026 (April through June) saw 98 single-family homes close across ZIPs 33178 and 33166. The Doral core (33178) posted a median sale price of $1,025,000 with 43 days on market and 3.7 months of supply. The Miami Springs edge (33166) posted a median sale price of $860,000 with 37 days on market and only 1.1 months of supply, indicating a much tighter seller's market. Sale-to-list price ratios sit at 95-96% across both ZIPs, suggesting sellers are pricing close to market rather than reaching for premium above ask.
In This Report
The Doral single-family market ran on two clocks in Q2 2026. Inside the core Doral ZIP of 33178 — home to Doral Isles, Doral Commons, Doral Breeze, and the newer master-planned communities — the market moved in balanced territory with a healthy pipeline of active inventory. Along the eastern edge in 33166, where Downtown Doral South Phase meets Country Club Estates and the older Miami Springs housing stock, the market ran significantly hotter: less than half the DOM in some segments and a fraction of the months-of-supply.
I'm Elizabeth Costa, a Realtor with The Keyes Company based in Doral. This report reflects the actual MLS data closed in the April 1 through June 30, 2026 window for single-family homes only. Every number below comes directly from that dataset — no forecasts, no borrowed estimates, no invented context.
Q2 2026 at a Glance
Combined single-family activity across the two Doral ZIPs (33178 and 33166) during Q2 2026:
Q2 2026 SFH Combined (ZIPs 33178 + 33166)
- Closed transactions: 98 single-family homes
- Currently active listings: 83 single-family homes
- Under contract (pending): 35 single-family homes
- Combined pipeline: 216 SFH transactions or pipeline entries in Q2
The two ZIPs diverge sharply once you separate them. Here is the side-by-side of the closed transactions:
| Metric (Closed Q2 2026) | ZIP 33178 (Doral core) | ZIP 33166 (Miami Springs edge) |
|---|---|---|
| Closed transactions | 53 | 45 |
| Median sale price | $1,025,000 | $860,000 |
| Median price per sqft | $393 | $486 |
| Median living sqft | 2,580 | 1,846 |
| Median days on market | 43 days | 37 days |
| Sale-to-list ratio | 96.2% | 95.7% |
| Sale-to-original-list ratio | 94.4% | 95.3% |
| Months of supply | 3.7 months | 1.1 months |
The single most striking pattern is not the price gap — it is the price-per-square-foot inversion. Homes in 33166 sold for $486 per square foot at the median while homes in 33178 sold for $393. The Miami Springs edge sits 24% higher on a per-square-foot basis despite lower absolute prices, driven by smaller lot sizes, older established inventory, and land scarcity along the corridor.
ZIP 33178 — Doral Core Deep Dive
The 33178 ZIP encompasses Doral's core master-planned communities and the newer developments west of the Palmetto Expressway. Median year built for the closed Q2 2026 sample was 2001, with construction ranging from 1987 to 2019.
Pricing and speed
- Median sale price: $1,025,000 across 53 closed transactions
- Mean sale price: $1,095,500 (the pull upward from luxury sales)
- Sale range: $580,000 low, $3,650,000 high
- Median price per square foot: $393
- Median days on market: 43 days
Price bracket distribution (Q2 2026 closed sales)
| Price Bracket | Closed | Share |
|---|---|---|
| Under $700,000 | 5 | 9% |
| $700,000 to $1,000,000 | 20 | 38% |
| $1,000,000 to $1,500,000 | 23 | 43% |
| $1,500,000 to $2,000,000 | 3 | 6% |
| $2,000,000 and above | 2 | 4% |
Over four in five sales in 33178 during Q2 2026 fell between $700,000 and $1,500,000. The luxury tier ($2M and above) accounted for only 4% of transactions, but the mean price of $1,095,500 sitting above the median of $1,025,000 confirms those luxury sales pulled the average upward.
Most active subdivisions (Q2 2026, closed sales)
| Subdivision | Closed | Median Sale | Median PPSF |
|---|---|---|---|
| Doral Commons Residential | 6 | $1,395,000 | $416 |
| Doral Breeze | 5 | $1,025,000 | $316 |
| Doral Isles Cayman | 4 | $960,000 | $445 |
| Doral Isles North Sec One | 3 | $1,080,000 | $378 |
Doral Commons Residential led both in transaction count and median price. Doral Breeze delivered five transactions at the exact median for the ZIP ($1,025,000), giving it strong pricing anchor status. The Doral Isles communities represented multiple sub-neighborhoods that together account for a meaningful share of Q2 closings.
The pool premium in 33178
Among the 53 closed sales in 33178:
- 15 homes with a pool sold at a median price per square foot of $447
- 38 homes without a pool sold at a median price per square foot of $373
The pool premium in 33178 works out to roughly 20% higher price per square foot compared to comparable homes without a pool. For seller strategy conversations, this is a meaningful data point — but it should be weighed against the actual maintenance cost, insurance implication, and neighborhood expectations rather than treated as automatic pricing math.
Waterfront and financing profile in 33178
- 13 of the 53 closed transactions (25%) were waterfront homes
- Financing mix on closed sales: 60% Conventional, 23% Cash, 6% FHA, 6% Non-Qualified Mortgage, 2% VA
The 23% cash share is notably higher than typical residential markets and reflects the international and investor buyer profile Doral consistently attracts. For sellers, this means offer strength is often less about DTI and more about proof-of-funds and timeline flexibility.
ZIP 33166 — Miami Springs Edge Deep Dive
ZIP 33166 covers the eastern edge of the Doral corridor, running into Miami Springs and Country Club Estates. The single-family stock here is significantly older than 33178 — median year built for closed Q2 2026 sales was 1953, with construction dates ranging from 1926 to 2024. This is established South Florida housing stock with mid-century architectural character.
Pricing and speed
- Median sale price: $860,000 across 45 closed transactions
- Mean sale price: $931,958
- Sale range: $530,000 low, $2,325,000 high
- Median price per square foot: $486
- Median days on market: 37 days
Note the DOM: 37 days versus 43 days in 33178. Combined with the months-of-supply metric below, 33166 is running as a meaningfully tighter market despite the lower absolute price point.
Price bracket distribution (Q2 2026 closed sales)
| Price Bracket | Closed | Share |
|---|---|---|
| Under $700,000 | 11 | 24% |
| $700,000 to $1,000,000 | 18 | 40% |
| $1,000,000 to $1,500,000 | 13 | 29% |
| $1,500,000 to $2,000,000 | 2 | 4% |
| $2,000,000 and above | 1 | 2% |
Nearly one in four sales in 33166 fell under $700,000 — a bracket that represents only 9% of activity in 33178. The center of gravity in 33166 sits in the $700K to $1M range (40% of transactions).
Most active subdivisions (Q2 2026, closed sales)
| Subdivision | Closed | Median Sale | Median PPSF |
|---|---|---|---|
| Downtown Doral South Phase | 8 | $1,057,500 | $467 |
| Country Club Estates Sec | 6 | $1,150,000 | $416 |
| Rev of Rev FEC Addn Hialeah | 5 | $700,000 | $526 |
| Golf Course Addn Hialeah | 4 | $792,500 | $491 |
Downtown Doral South Phase led activity at 8 closed transactions — this subdivision straddles the ZIP boundary and reflects the newer Downtown Doral inventory even when the ZIP designation reads 33166. Country Club Estates delivered the highest median at $1,150,000. The older established communities (Rev of Rev FEC Addn Hialeah, Golf Course Addn Hialeah) trade at lower absolute prices but at higher PPSF, consistent with the smaller lot pattern.
Financing profile in 33166
- Financing mix on closed sales: 69% Conventional, 16% Cash, 4% VA, 4% Non-QM, 4% FHA
- Waterfront share: 3 of 45 (7%)
Cash share in 33166 is meaningfully lower than 33178 (16% versus 23%), consistent with 33166's older, more owner-occupant profile compared to Doral core's international and investor mix.
Months of Supply and Absorption
Months of supply is calculated as (active inventory) divided by (average monthly closed sales during Q2). A value of 6 months is generally considered a balanced market. Above 6 months tips toward buyer's favor. Below 6 months tips toward seller's favor.
Q2 2026 Months of Supply — SFH
- ZIP 33178: 66 active listings, average 17.7 closings per month, 3.7 months of supply — balanced-to-seller's-market territory
- ZIP 33166: 17 active listings, average 15.0 closings per month, 1.1 months of supply — strong seller's-market territory
This is the single most important divergence between the two ZIPs. In 33178, buyers currently have 66 active options to choose from and homes are moving at a pace that gives negotiation room. In 33166, buyers have only 17 active options against nearly the same monthly demand, producing a much tighter market where well-priced listings tend to move quickly.
For sellers, this changes the strategy conversation. A seller in 33178 typically prices to compete against active inventory. A seller in 33166 typically prices to test demand, because the inventory competition is thinner.
June 2026 Highlight
Isolating June closings from Q2 shows the trajectory heading into summer:
June 2026 SFH Closings
- ZIP 33178: 14 closings in June (down from 21 in April, 18 in May) — a modest slowdown into summer
- Median June sale price 33178: $962,500 (below the Q2 median of $1,025,000)
- Median June PPSF 33178: $399 (essentially flat versus the Q2 median of $393)
- ZIP 33166: 18 closings in June (up from 10 in April, 15 in May) — accelerating through the quarter
- Median June sale price 33166: $882,000 (slightly above the Q2 median of $860,000)
- Median June PPSF 33166: $501 (above the Q2 median of $486)
The two ZIPs finished the quarter moving in opposite directions on volume: 33178 cooling modestly, 33166 accelerating. Price levels remained roughly consistent in both, meaning the change is happening on transaction count rather than pricing power.
What Q2 2026 Tells Sellers
Three practical takeaways for homeowners considering a listing in either ZIP:
1. Price close to market, not above. Both ZIPs are closing at 94-96% of the original list price. That means sellers who priced with a "test the top" cushion of 5% or more spent longer on market and often adjusted before selling. Pricing within 2-3% of expected sale is delivering faster closings and stronger negotiations.
2. In 33166, use inventory scarcity carefully. With only 1.1 months of supply, sellers have meaningful pricing leverage. But the sale-to-original ratio of 95.3% shows that overpricing still costs time. The "leverage" is not about pushing higher — it is about attracting multiple qualified offers at a fair market price.
3. In 33178, feature curation matters more. With 3.7 months of supply and buyers seeing 66 active options, staging, professional photography, updated finishes, and pool marketing become more consequential to standing out. The 20% pool PPSF premium in the closed data is a data point worth understanding before pricing.
What Q2 2026 Tells Buyers
Three practical takeaways for buyers active in the Doral area:
1. Cash-buyer competition is real in 33178. Nearly one in four Q2 closings was a cash transaction. For financed buyers, this means offer strength matters more than a slight price stretch — pre-approval quality, loan officer credibility, and appraisal contingency handling can all influence the seller's decision beyond the number.
2. In 33166, act on well-priced inventory quickly. With 37 median days on market and 1.1 months of supply, well-priced listings do not sit. Buyers who are pre-approved and available for immediate showings have a structural advantage over those still in the pre-shopping phase.
3. The PPSF difference is real, not noise. Paying $486 per square foot in 33166 versus $393 in 33178 reflects lot size and land-scarcity dynamics, not equivalent value. Compare on total sale price and living area rather than PPSF alone when evaluating options across the two ZIPs.
Data Methodology and Sources
All data in this report comes directly from Miami-Dade MLS records exported at the end of the second quarter 2026 (window: April 1 through June 30). Universe:
- Property type: Single-family homes (SFH) only. Condos, townhomes, and multi-family are not included in this report.
- ZIPs covered: 33178 (Doral core) and 33166 (Miami Springs edge and eastern Doral corridor). ZIP 33172 was reviewed but excluded — the single-family universe for that ZIP was below 10 records across active, pending, and closed categories, which is insufficient for statistically reliable trend analysis.
- Sample sizes: 66 active, 24 pending, 53 closed in 33178. 17 active, 11 pending, 45 closed in 33166.
- Calculations: Medians are used rather than averages wherever possible to resist outlier distortion. Months of supply is calculated as active inventory divided by average monthly closings during Q2 (closings divided by 3).
For deeper context on Miami-Dade market data across all property types, the Miami Association of Realtors statistics library publishes monthly summaries at the county level. For further context on national single-family trends, the National Association of Realtors research library is the standard reference.
This report is not a formal appraisal. Nothing here should substitute for a professional Comparative Market Analysis (CMA) tailored to a specific property. If you need pricing context for a specific address in Doral, I am happy to prepare a full CMA based on same-subdivision comps and recent activity.
Frequently Asked Questions
Want a Custom CMA for Your Doral Address?
This report gives you the ZIP-wide picture. For specific pricing context on your own home — with same-subdivision comps and current-market positioning — I can prepare a full CMA at no cost.
Call or Text (786) 949-3971The Keyes Company · 4191 NW 107th Ave, Doral, FL 33178
elizabethcosta@keyes.com · Schedule a Consultation
Serving Doral, Miami, Coral Gables, and Pinecrest
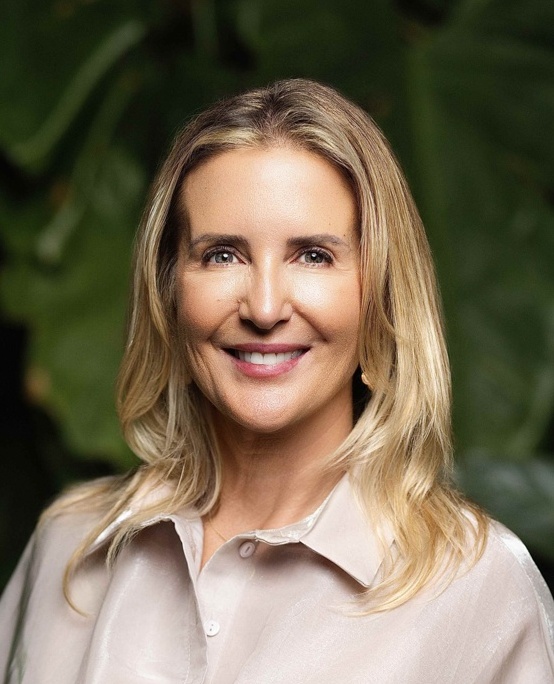 |
Elizabeth Costa, Realtor — FL Lic. #3234205 Top Real Estate Agent in Doral, Florida | The Keyes Company ☎ (786) 949-3971 ✉ elizabethcosta@keyes.com 📅 Schedule a private consultation 15+ years · 300+ closed transactions · Bilingual EN/ES Office: 4191 NW 107th Ave, Doral, FL 33178 Serving Doral, Miami, Coral Gables, and Pinecrest |