By Elizabeth Costa — Top Real Estate Agent in Doral, Florida | The Keyes Company
15+ years of experience · 300+ closed transactions · Bilingual: English & Spanish
How is the Coral Gables area real estate market performing in Q2 2026?
Q2 2026 (April through June) saw 348 single-family homes close across six ZIPs anchored by Coral Gables: 33134, 33133 (Coconut Grove), 33156 (Pinecrest), 33146, 33143 (South Miami), and 33158 (Palmetto Bay). Combined months of supply sits at 2.2 — strong seller's market territory across the entire corridor. Median sale prices range from $1,535,000 in Coral Gables core (33134) to $2,900,000 in South Miami / High Pines (33143). Cash accounted for 46 to 67 percent of transactions across ZIPs, meaningfully higher than the county-wide average, reflecting the international, investor, and wealth-driven buyer profile the corridor attracts.
In This Report
- Q2 2026 at a Glance — Corridor Overview
- Corridor-Wide Patterns
- ZIP 33134 — Coral Gables Core
- ZIP 33133 — Coconut Grove
- ZIP 33156 — Pinecrest and Palmetto Estates
- ZIP 33146 — Coral Gables Riviera and South Miami
- ZIP 33143 — South Miami and High Pines
- ZIP 33158 — Palmetto Bay
- June 2026 Highlight
- What Q2 2026 Tells Sellers
- What Q2 2026 Tells Buyers
- Data Methodology and Sources
- Frequently Asked Questions
The Coral Gables corridor is not a single market. It is a chain of six ZIP codes running south along Biscayne Bay from Miracle Mile through Coconut Grove, Pinecrest, High Pines, and Palmetto Bay. Each has its own architectural character, price band, and buyer profile. Grouped together, they form one of the most consistently high-value single-family markets in Miami-Dade County — and in Q2 2026, all six ran as seller's markets on inventory alone, but with meaningfully different pricing dynamics.
I'm Elizabeth Costa, a Realtor with The Keyes Company. This report reflects the actual MLS data closed in the April 1 through June 30, 2026 window for single-family homes only. Every number below comes directly from that dataset — no forecasts, no borrowed estimates.
Q2 2026 at a Glance - Corridor Overview
Combined single-family activity across the six corridor ZIPs during Q2 2026:
Q2 2026 SFH Combined (6 Corridor ZIPs)
- Closed transactions: 348 single-family homes
- Currently active listings: 259 single-family homes
- Under contract (pending): 149 single-family homes
- Combined pipeline: 756 SFH transactions or pipeline entries in Q2
- Combined months of supply: 2.2 months (strong seller's market territory)
Here is the side-by-side of closed transactions, sorted by median sale price:
| ZIP | Area | Closed | Median Sale | Median PPSF | DOM | Months Supply |
|---|---|---|---|---|---|---|
| 33143 | South Miami / High Pines | 69 | $2,900,000 | $936 | 57 | 1.8 |
| 33133 | Coconut Grove | 73 | $2,650,000 | $1,081 | 36 | 1.9 |
| 33156 | Pinecrest / Palmetto Estates | 80 | $2,567,500 | $745 | 61 | 3.0 |
| 33146 | Coral Gables Riviera / South Miami | 24 | $1,925,000 | $935 | 31 | 2.6 |
| 33158 | Palmetto Bay | 24 | $1,895,000 | $574 | 65 | 2.0 |
| 33134 | Coral Gables core | 78 | $1,535,000 | $825 | 51 | 2.1 |
All six ZIPs sit below 3.5 months of supply. All six posted meaningful closed volume. Median sale prices span nearly two-to-one, from $1,535,000 to $2,900,000. Median price per square foot spans nearly two-to-one in the opposite direction — from $574 in Palmetto Bay to $1,081 in Coconut Grove.
Corridor-Wide Patterns
Before the ZIP-by-ZIP detail, three patterns show up consistently across all six markets in Q2 2026:
1. Cash dominates every ZIP
Cash accounted for between 46 and 67 percent of closed transactions in each corridor ZIP. This is meaningfully above county-wide averages and reflects the international, investor, and wealth-driven buyer profile that this corridor consistently attracts.
- Highest cash share: ZIP 33133 Coconut Grove at 67% cash
- Second: ZIP 33156 Pinecrest at 57% cash
- Third: ZIP 33143 South Miami at 54% cash
- Fourth: ZIP 33146 Coral Gables Riviera at 50% cash
- Tied lowest: ZIP 33134 Coral Gables core and ZIP 33158 Palmetto Bay at 46% cash
For financed buyers competing in this corridor, this is one of the most important context points in the entire report. Nearly half of transactions do not depend on financing contingencies, appraisal outcomes, or loan-timeline pressure. Offer strength for financed buyers has to compete on non-price dimensions.
2. Sellers are testing the top of the range
Sale-to-original-list-price ratios sit between 89.6 percent and 95.3 percent across the corridor. For comparison, Doral single-family sales in the same Q2 window closed at 94.4 to 95.3 percent of original list. The Coral Gables corridor is showing wider negotiation spreads, particularly at the upper price bands.
- ZIP 33146: 95.3% (tightest)
- ZIP 33134: 92.6%
- ZIP 33143: 92.1%
- ZIP 33156: 91.9%
- ZIP 33133: 91.4%
- ZIP 33158: 89.6% (widest)
This pattern is consistent with a market where sellers are pricing to test the upper end of the range and buyers are negotiating meaningful discounts. In a market where all six ZIPs have less than 3.5 months of supply, this negotiation dynamic is less about weak demand and more about pricing discipline on the seller side.
3. The PPSF and total-price relationship inverts
The most expensive ZIP by total median sale price is ZIP 33143 South Miami / High Pines at $2,900,000. The most expensive by PPSF is ZIP 33133 Coconut Grove at $1,081. Palmetto Bay 33158 has the lowest PPSF ($574) despite a $1,895,000 median — because Palmetto Bay sits on larger lots with older established homes.
Corridor-wide PPSF ranking:
- ZIP 33133 Coconut Grove: $1,081 PPSF
- ZIP 33146 Coral Gables Riviera: $935 PPSF
- ZIP 33143 South Miami: $936 PPSF
- ZIP 33134 Coral Gables core: $825 PPSF
- ZIP 33156 Pinecrest: $745 PPSF
- ZIP 33158 Palmetto Bay: $574 PPSF
When evaluating options across the corridor, comparing PPSF alone can mislead you — a Coconut Grove home at $1,081 PPSF and a Palmetto Bay home at $574 PPSF are different products, not different values.
ZIP 33134 — Coral Gables Core
ZIP 33134 covers the historic core of Coral Gables including Miracle Mile, the Country Club sections, and Coral Way. Housing stock is the oldest in the corridor — median year built for closed Q2 2026 sales was 1951. Median living area was 1,839 square feet, the smallest in the corridor. Older, more compact, more established.
- Closed: 78 transactions (median $1,535,000, mean $1,933,535, range $530,000 to $7,600,000)
- Median PPSF: $825
- Median DOM: 51 days
- Sale-to-list: 95.7% | Sale-to-original: 92.6%
- Months of supply: 2.1
- Cash share: 46%
- Waterfront: 1 of 78 (waterfront is rare in 33134)
Pool premium in 33134
Among closed sales, 30 homes with a pool sold at a median of $983 per square foot compared to $708 per square foot for the 48 homes without a pool. That works out to a 39% price-per-square-foot premium for a pool — the widest pool premium in the corridor. Coral Gables core is a market where the outdoor living component carries real weight.
Most active 33134 subdivisions
- Coral Gables Granada Sec: 10 sales, $1,775,000 median
- Coral Gables Country Club: 6 sales, $2,595,000 median
- Coral Gables Sec E: 5 sales, $3,300,000 median
- C Gab Country Club Sec 6: 3 sales, $1,400,000 median
- Coral Gables Sec B: 3 sales, $1,930,000 median
Price band distribution: 31% under $1M, 35% in $1M-$2M, 15% each in $2M-$3M and $3M-$5M, 4% $5M-$10M, and no closings above $10M in Q2. The historic core is broad-based rather than ultra-luxury concentrated.
ZIP 33133 — Coconut Grove
ZIP 33133 covers Coconut Grove, one of Miami's oldest neighborhoods with a distinct village character. Median year built was 1956. Median living area was 2,431 square feet. Coconut Grove sits at the intersection of Bayfront estates, walkable village blocks, and pockets of ultra-luxury waterfront.
- Closed: 73 transactions (median $2,650,000, mean $3,384,156, range $600,000 to $16,350,000)
- Median PPSF: $1,081 — highest in the corridor
- Median DOM: 36 days
- Sale-to-list: 95.2% | Sale-to-original: 91.4%
- Months of supply: 1.9 — tied second tightest
- Cash share: 67% — highest in the corridor
- Waterfront: 3 of 73 sold as waterfront, median $16,300,000
Pool premium in 33133
Among closed sales, 38 homes with a pool sold at a median of $1,208 per square foot compared to $926 per square foot for the 35 without. A 30% PPSF premium on the pool. In Coconut Grove specifically, pool is nearly universal in the higher tiers.
Most active 33133 subdivisions
- Frow Homestead: 6 sales, $1,237,500 median
- Utopia: 3 sales, $2,250,000 median
- Natoma Manors: 3 sales, $2,685,000 median
- Ocean View Heights: 3 sales, $4,500,000 median
- Coco Gve Pk 2 Amd: 3 sales, $2,100,000 median
- Amd Pl of Bonita Park: 3 sales, $5,300,000 median
Coconut Grove had 14% of closings above $5M (10 transactions), including 5 transactions above $10M. This is the second-highest ultra-luxury concentration in the corridor after Pinecrest.
ZIP 33156 — Pinecrest and Palmetto Estates
ZIP 33156 covers Pinecrest and includes portions of Palmetto Estates and Old Cutler Bay. This is the largest-lot ZIP in the corridor by median living area — 3,595 square feet median — and the largest closed sample at 80 transactions. Median year built was 1972.
- Closed: 80 transactions (median $2,567,500, mean $5,381,022, range $849,900 to $47,000,000)
- Median PPSF: $745
- Median DOM: 61 days — longer, reflecting larger properties and higher price bands
- Sale-to-list: 92.9% | Sale-to-original: 91.9%
- Months of supply: 3.0 — highest in the corridor but still seller's market
- Cash share: 57%
- Waterfront: 15 of 80, median waterfront sale $5,875,000, waterfront PPSF $1,388
Pool prevalence in 33156
Pools are near-universal in Pinecrest — 71 of the 80 closed sales (89 percent) had a pool. This is the highest pool share in the corridor. In Pinecrest, the market expectation is essentially a pool as baseline rather than a premium feature.
Most active 33156 subdivisions
- Rock Lake: 4 sales, $2,125,000 median
- Unplatted: 3 sales, $2,800,000 median
- Old Cutler Bay Sec 1: 3 sales, $15,600,000 median, $4,643 PPSF
- Continental Homes: 2 sales, $1,520,000 median
- Devonwood: 2 sales, $11,025,000 median
Pinecrest had 14% of closings above $10M (11 transactions), the highest ultra-luxury concentration in the corridor. Old Cutler Bay Sec 1 and Devonwood are the anchor ultra-luxury sub-neighborhoods driving that share.
ZIP 33146 — Coral Gables Riviera and South Miami
ZIP 33146 is the smallest sample in the corridor — 24 closed sales — but with meaningful signal. Covers Coral Gables Riviera and portions of South Miami adjacent to the University of Miami. Median year built 1956, median living area 2,456 square feet.
- Closed: 24 transactions (median $1,925,000, mean $2,377,812, range $905,000 to $5,100,000)
- Median PPSF: $935
- Median DOM: 31 days — fastest in the corridor
- Sale-to-list: 95.4% | Sale-to-original: 95.3% — tightest negotiation in the corridor
- Months of supply: 2.6
- Cash share: 50%
- Waterfront: 3 of 24, median waterfront sale $4,000,000
Pool premium in 33146
13 homes with a pool sold at a median of $1,186 per square foot compared to $740 per square foot for the 11 without. A 60% PPSF premium on the pool — the widest premium in the corridor, though the sample size is small.
Most active 33146 subdivisions
- Coral Gables Riviera Sec: 7 sales, $3,700,000 median
- C Gab Riviera Sec Pt 2 Rev: 5 sales, $1,560,000 median
- CG Riviera Sec 3 Rev: 2 sales, $2,456,250 median
The 31-day median DOM combined with the 95.3% sale-to-original ratio makes 33146 the tightest-pricing and fastest-moving market in the corridor. Well-priced listings here move quickly and close near ask.
ZIP 33143 — South Miami and High Pines
ZIP 33143 covers South Miami, High Pines, and portions of the Coral Gables Biscayne Bay sections. This is the highest median sale price in the corridor at $2,900,000, with a wide luxury spread. Median year built 1978, median living area 3,122 square feet.
- Closed: 69 transactions (median $2,900,000, mean $4,708,397, range $609,000 to $25,365,280)
- Median PPSF: $936
- Median DOM: 57 days
- Sale-to-list: 94.5% | Sale-to-original: 92.1%
- Months of supply: 1.8 — tightest in the corridor
- Cash share: 54%
- Waterfront: 9 of 69
Pool premium in 33143
49 homes with a pool sold at a median of $1,006 per square foot compared to $679 per square foot for the 20 without. A 48% PPSF premium on the pool.
Most active 33143 subdivisions
- Amd Plat of High Pines: 3 sales, $1,650,000 median
- High Pines Rev Plat of 2nd: 3 sales, $4,950,000 median
- Groves Extension: 2 sales, $3,250,000 median
- Kingsleys Sub: 2 sales, $3,400,000 median
- Coral Gables Bisc Bay Sec: 2 sales, $2,940,000 median
South Miami and High Pines had 13% of closings above $10M (9 transactions). The 1.8 months of supply combined with 92.1% sale-to-original ratio shows the highest inventory pressure in the corridor coexisting with the widest negotiation spread — sellers are pricing high, buyers are still competing for limited inventory, and the two forces meet at a real discount off original ask.
ZIP 33158 — Palmetto Bay
ZIP 33158 covers Palmetto Bay and portions of the Old Cutler corridor. Median year built 1969, median living area 3,127 square feet — comparable in home size to 33143 but at a lower price point.
- Closed: 24 transactions (median $1,895,000, mean $2,459,708, range $950,000 to $6,200,000)
- Median PPSF: $574 — lowest in the corridor
- Median DOM: 65 days — longest in the corridor
- Sale-to-list: 94.3% | Sale-to-original: 89.6% — widest negotiation spread in the corridor
- Months of supply: 2.0
- Cash share: 46%
- Waterfront: 1 of 24
Pool prevalence in 33158
22 of 24 closed sales (92 percent) had a pool. Pool is essentially the baseline expectation here, similar to Pinecrest.
Most active 33158 subdivisions
- Farmers Acres: 2 sales, $4,192,500 median
- Old Cutler Estates Sec 2: 2 sales, $1,500,000 median
- Mangowood: 2 sales, $1,695,000 median
- Deering Bay Estates: 2 sales, $3,800,000 median
Palmetto Bay stands out as the value tier of the corridor on a PPSF basis. Larger lots, longer DOM, wider negotiation spread, but tight enough inventory that the corridor-wide dynamics still apply.
June 2026 Highlight
Isolating June closings from Q2 shows how the quarter finished across the corridor:
| ZIP | June Closings | June Median | Q2 Median | Direction |
|---|---|---|---|---|
| 33134 Coral Gables core | 30 | $1,100,000 | $1,535,000 | Mix shift lower |
| 33133 Coconut Grove | 27 | $1,885,000 | $2,650,000 | Mix shift lower |
| 33156 Pinecrest | 31 | $2,560,000 | $2,567,500 | Essentially flat |
| 33146 CG Riviera | 3 | $3,200,000 | $1,925,000 | Small sample, upper tier |
| 33143 South Miami | 27 | $4,590,000 | $2,900,000 | Luxury tier accelerating |
| 33158 Palmetto Bay | 9 | $2,200,000 | $1,895,000 | Up modestly |
Volume was flat-to-up in most ZIPs — corridor-wide, June was neither a slowdown nor an acceleration on transaction count. Median prices shifted notably in individual ZIPs, but the shifts reflect mix changes (which properties happened to close in June) rather than pricing power moves. The most striking mix-shift is ZIP 33143 where the June median of $4,590,000 sits well above the full Q2 median of $2,900,000, indicating that the luxury and ultra-luxury tier drove closings in June.
What Q2 2026 Tells Sellers
Three practical takeaways for homeowners considering a listing in the corridor:
1. Cash competition is real, and it changes what winning an offer looks like. When cash is 46-67% of your buyer pool, the top offer is not always the highest number. Cash offers with short close timelines, no financing contingency, and appraisal-flexible terms often win over higher financed offers. Sellers pricing at the top of the market should expect their initial offers to come in below list, particularly from cash buyers signaling their leverage.
2. Original list price matters more than list price. Sale-to-original ratios across the corridor sit at 89.6-95.3%, wider than most Miami-Dade markets. That gap between original list and final sale means that reductions from the initial price are being absorbed as normal negotiation, not signals of trouble. But it also means the initial pricing choice needs to be defensible — starting 10-15% above realistic market value costs weeks of DOM and often ends at the same final number.
3. Pool marketing matters more here than in most Miami-Dade markets. Pool premiums range from 30% to 60% PPSF across the corridor ZIPs. In Coral Gables core (33134), Coral Gables Riviera (33146), and South Miami (33143), the pool premium is 39-60% — meaningful even when the pool needs maintenance work. When a home has a pool, professional pool photography, evening water lighting shots, and outdoor living staging should be non-negotiable.
What Q2 2026 Tells Buyers
Three practical takeaways for buyers active in the corridor:
1. Financed buyers need to understand the corridor's cash dynamic. If 46-67% of your competition is cash, the standard financed offer template does not win. Offer strength has to include: lender responsiveness, appraisal contingency handling, escrow deposit size, and inspection timing. The right lender in this corridor can make the difference between a winning and losing offer at the same dollar amount.
2. The value tier lives in Palmetto Bay and Coral Gables core. ZIP 33158 at $574 PPSF and ZIP 33134 at $825 PPSF offer meaningfully more square footage per dollar than Coconut Grove's $1,081 PPSF. If square footage and lot size are your priority over walkability or neighborhood cachet, the value math shifts toward the southern end of the corridor.
3. Well-priced listings in 33146 do not sit. With 31-day median DOM and 95.3% sale-to-original ratio, ZIP 33146 is the tightest market in the corridor. Buyers targeting this ZIP need to be pre-approved, available for immediate showings, and ready to write offers within 48 hours of a listing hitting the market. Waiting for weekend showings is not a competitive posture here.
Data Methodology and Sources
All data in this report comes directly from Miami-Dade MLS records exported at the end of the second quarter 2026 (window: April 1 through June 30). Universe:
- Property type: Single-family homes (SFH) only. Condos, townhomes, and multi-family are not included in this report.
- ZIPs covered: 33134 (Coral Gables core), 33133 (Coconut Grove), 33156 (Pinecrest / Palmetto Estates), 33146 (Coral Gables Riviera / South Miami), 33143 (South Miami / High Pines), 33158 (Palmetto Bay).
- Sample sizes (closed / active / pending): 33134: 78 / 54 / 28. 33133: 73 / 46 / 36. 33156: 80 / 80 / 47. 33146: 24 / 21 / 9. 33143: 69 / 42 / 22. 33158: 24 / 16 / 7. Combined: 348 / 259 / 149.
- Calculations: Medians are used rather than averages wherever possible to resist outlier distortion. Means are shown alongside for context in ZIPs where a wide luxury tail pulls averages meaningfully above medians. Months of supply is calculated as active inventory divided by average monthly closings during Q2 (closings divided by 3).
For deeper context on Miami-Dade market data across all property types, the Miami Association of Realtors statistics library publishes monthly summaries at the county level. For national single-family trend context, the National Association of Realtors research library is the standard reference.
This report is not a formal appraisal. Nothing here should substitute for a professional Comparative Market Analysis (CMA) tailored to a specific property. If you need pricing context for a specific address in Coral Gables, Coconut Grove, Pinecrest, South Miami, or Palmetto Bay, I am happy to prepare a full CMA based on same-subdivision comps and recent activity.
Frequently Asked Questions
Want a Custom CMA for Your Coral Gables Address?
This report gives you the corridor-wide picture. For pricing context specific to your home — with same-subdivision comps and current-market positioning — I can prepare a full CMA at no cost.
Call or Text (786) 949-3971The Keyes Company · 4191 NW 107th Ave, Doral, FL 33178
elizabethcosta@keyes.com · Schedule a Consultation
Serving Doral, Miami, Coral Gables, Coconut Grove, Pinecrest, South Miami, and Palmetto Bay
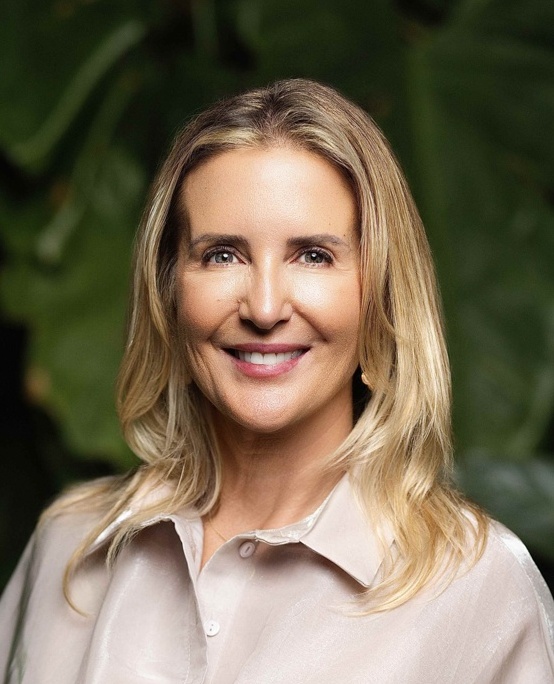 |
Elizabeth Costa, Realtor — FL Lic. #3234205 Top Real Estate Agent in Doral, Florida | The Keyes Company ☎ (786) 949-3971 ✉ elizabethcosta@keyes.com 📅 Schedule a private consultation 15+ years · 300+ closed transactions · Bilingual EN/ES Office: 4191 NW 107th Ave, Doral, FL 33178 Serving Doral, Miami, Coral Gables, Coconut Grove, Pinecrest, South Miami, and Palmetto Bay |