


By Elizabeth Costa - Top Real Estate Agent in Doral, Florida | The Keyes Company
15+ years of experience · 300+ closed transactions · Bilingual: English & Spanish
Exclusive Member of Forbes Global Properties · Founding Member of Luxury Portfolio International
Doral vs Coral Gables: which is better for a Miami home purchase?
Doral (incorporated as a city in 2003) and Coral Gables (founded 1925 as the "City Beautiful") are two of Miami-Dade's most sought-after markets for buyers, but they represent fundamentally different real estate propositions. Based on Miami-Dade MLS data through August 28, 2026: Doral (aggregate of ZIPs 33178, 33166, 33172) closed 134 single-family homes at a median $1,012,500 with median $409 per square foot in newer construction (median year built 2002), 19 percent cash share, 18 percent waterfront, median $406 monthly HOA, and median $12,020 annual property tax. The Coral Gables area (aggregate of ZIPs 33134, 33146, 33156, 33133) closed 185 single-family homes at a median $2,300,000 with median $941 per square foot in established construction (median year built 1958), 55 percent cash share, 17 percent waterfront, median $350 monthly HOA (fewer HOA-governed properties), and median $18,231 annual property tax. Both markets are Strong Seller conditions (Doral 2.8 MOI, Coral Gables 2.4 MOI) with identical median 42 days on market and near-identical 95-96 percent sale-to-list ratios. Coral Gables prices at 127 percent premium to Doral on median sale price and 130 percent premium on price per square foot, reflecting historic architecture premium, established landscaping, and concentrated wealth of a nearly-100-year-old city. Doral offers newer construction (44-year median build gap), lower carrying costs, and a rapidly-modernizing city character.
In This Comparison
- Doral vs Coral Gables at a Glance
- City Character: 2003 vs 1925 (78 Years of History Difference)
- Doral Market Profile (3 ZIPs)
- Coral Gables Area Market Profile (4 ZIPs)
- The Pricing Divergence: 127% Premium Story
- The Cash Story: 55% vs 19% Buyer Composition
- Construction Age: 44-Year Median Build Gap
- Sub-Market Detail (By ZIP)
- Carrying Costs and Investment Math
- The Buyer Profiles: Who Chooses Each
- Decision Framework: Which Suits You?
- Methodology and Data Sources
- Frequently Asked Questions
Doral vs Coral Gables is one of the most common comparison questions I hear from relocation buyers considering Miami-Dade. Both are established markets with strong buyer demand. Both attract international and cash-heavy buyer flows. But the two markets represent fundamentally different real estate propositions: Doral is a young, modern, growing city with newer construction and entry-luxury-to-mid-luxury price bands; Coral Gables is a historic, established, "City Beautiful" heritage market with premium price-per-square-foot reflecting nearly 100 years of curated urban design.
I am Elizabeth Costa, a Realtor with The Keyes Company. I work transactions in both markets. This guide is the complete side-by-side comparison based on 90 days of Miami-Dade MLS data through late August 2026, with sub-market detail, buyer profile framework, and decision guidance. The comparison uses data from 134 Doral single-family closings plus 185 Coral Gables area single-family closings, aggregate sample of 319 transactions.
Doral vs Coral Gables at a Glance
| Dimension | Doral (3 ZIPs) | Coral Gables Area (4 ZIPs) | Delta |
|---|---|---|---|
| Closed sales (90d) | 134 | 185 | CG +38% |
| Median sale price | $1,012,500 | $2,300,000 | CG +127% |
| Price range | $419K - $3.65M | $610K - $47M | CG wider top |
| Median $/sqft | $409 | $941 | CG +130% |
| Median SqFt Living | 2,462 | 2,482 | Similar |
| Median year built | 2002 | 1958 | 44 years older |
| Median DOM | 42 days | 42 days | Identical |
| Sale-to-list ratio | 96.5% | 95.0% | Doral +1.5pp |
| Cash share | 19% | 55% | CG +36pp |
| Waterfront % | 18% | 17% | Similar |
| Pool % | 26% | 55% | CG +29pp |
| Median HOA (monthly) | $406 | $350 | Doral +$56/mo |
| Median annual tax | $12,020 | $18,231 | CG +52% |
| Active inventory | 123 | 148 | - |
| MOI (Strong Seller <3) | 2.8 (Strong Seller) | 2.4 (Strong Seller · tighter) | CG tighter |
The 90-second read: Doral and Coral Gables area are similar on transaction velocity (42-day DOM both, 95-96% sale-to-list both) and similar on waterfront share (17-18% both), similar on median home size (~2,470 sqft both). They diverge dramatically on price (Coral Gables 127% premium), $/sqft (Coral Gables 130% premium), cash share (Coral Gables 3x Doral), pool prevalence (Coral Gables 2x Doral), and construction age (Coral Gables median 44 years older). Both are Strong Seller markets. Coral Gables is meaningfully tighter (2.4 MOI vs 2.8).
City Character: 2003 vs 1925 (78 Years of History Difference)
The most important context for understanding the price divergence is that Doral and Coral Gables are cities of fundamentally different ages and design philosophies.
Coral Gables (founded 1925)
Coral Gables was founded by George Merrick in 1925 as one of the earliest master-planned "New Towns" in the United States. Merrick's vision, executed with architect Denman Fink and landscape architect Frank Button, was a Mediterranean Revival "City Beautiful" with curved streets, distinctive plazas, iconic entrances, and consistent Mediterranean architectural language. The University of Miami relocated to Coral Gables in 1926. The Biltmore Hotel opened the same year. The city was originally designed around the concept of "livable urban design" that predated most of contemporary American suburban development.
Today, Coral Gables preserves this heritage with strict architectural review and historic preservation across neighborhoods. Sections A, B, C, D, and E maintain their original Mediterranean character. The Riviera, Country Club, Old Cutler Road, and Riviera sections offer some of Miami-Dade's most preserved historic residential inventory. The Merrick Estate designation program protects historic homes. This heritage character is a specific value driver reflected in the $941 median $/sqft.
Doral (incorporated as a city 2003)
Doral was incorporated as a city in 2003, less than 25 years ago. The area developed from the Doral Country Club (founded 1962 by Doris and Alfred Kaskel, hence "Do-Ral") and evolved through the 1980s and 1990s into a corporate business district and residential community. In 2003, incorporation created the City of Doral with rapid population growth from ~20,000 to over 75,000 in the following two decades.
Modern Doral is characterized by newer construction (median year built 2002 for recently closed homes), master-planned residential communities (Doral Isles, Doral Estates, Doral Meadows), and the newer Downtown Doral mixed-use district developed by Codina Partners starting 2010. Doral is home to Trump National Doral Miami (formerly Doral Resort and Spa), the Miami International Mall district, and major corporate headquarters including Carnival Corporation.
The city character difference is not opinion; it is measured in the 44-year median build gap between the two markets' recently sold inventory. Coral Gables sellers are largely trading 1950s-1960s architecture with heritage preservation. Doral sellers are largely trading 2000s-2020s modern construction.
Doral Market Profile (3 ZIPs)
90-day snapshot (Miami-Dade MLS through August 27, 2026):
- 134 closed single-family sales, 123 active listings, 16 pending
- Median sale price $1,012,500; range $419,900 to $3,650,000
- Median $/sqft $409, median SqFt Living 2,462
- Median year built 2002 (range 1984 to 2025 for closed sales)
- Median 42 days on market, 96.5 percent sale-to-list ratio
- 19 percent cash share (26 of 134)
- 18 percent waterfront homes, 26 percent with pool
- Median monthly HOA $406, median annual property tax $12,020
- 2.8 months of inventory (Strong Seller's market)
Sub-market composition
- ZIP 33178 (Doral Core + Doral Isles): 105 closed at median $990,000, $/sqft $393, 47 DOM, 96 percent SP/LP, 16 percent cash. 102 active, 2.9 MOI. Predominant SFH inventory including Doral Isles master-planned gated community and Doral Core communities.
- ZIP 33166 (Downtown Doral + adjacent Miami Springs area): 21 closed at median $1,100,000, $/sqft $488, 42 DOM, 96 percent SP/LP, 29 percent cash. 16 active, 2.3 MOI. Home to the Downtown Doral master-planned district (Downtown Doral South, Canarias sub-communities).
- ZIP 33172 (Doral / Fontainebleau): 8 closed at median $767,500, $/sqft $438, 9 DOM, 99 percent SP/LP, 38 percent cash. 5 active, 1.9 MOI. Predominantly commercial/industrial ZIP with limited SFH inventory (small sample).
For deeper Doral analysis, see the Doral Market Report July 2026 and the sub-community comparison Downtown Doral vs Doral Isles.
Coral Gables Area Market Profile (4 ZIPs)
90-day snapshot (Miami-Dade MLS through August 28, 2026):
- 185 closed single-family sales, 148 active listings, 20 pending
- Median sale price $2,300,000; range $610,000 to $47,000,000
- Median $/sqft $941, median SqFt Living 2,482
- Median year built 1958 (range 1922 to 2026 for closed sales)
- Median 42 days on market, 95.0 percent sale-to-list ratio
- 55 percent cash share (102 of 185)
- 17 percent waterfront homes, 55 percent with pool
- Median monthly HOA $350 (fewer HOA-governed properties)
- Median annual property tax $18,231
- 2.4 months of inventory (Strong Seller's market)
Sub-market composition (by ZIP)
- ZIP 33134 (Coral Gables Core): 95 closed at median $1,845,000, $/sqft $892, 42 DOM, 95 percent SP/LP, 53 percent cash, median year built 1952. 69 active, 2.2 MOI. The historic heart including Sections B and E, Country Club Prado, and the Biltmore corridor.
- ZIP 33146 (Coral Gables Riviera): 47 closed at median $2,300,000, $/sqft $973, 23 DOM (fastest sub-market), 97 percent SP/LP, 53 percent cash, median year built 1956. 39 active, 2.5 MOI. Riviera Sections 3, 5, 10, and Country Club areas.
- ZIP 33156 (Pinecrest / South Coral Gables): 28 closed at median $6,390,000, $/sqft $1,406, 108 DOM, 92.5 percent SP/LP, 68 percent cash, median year built 1979, 68 percent waterfront. 31 active, 3.3 MOI. Home to Gables Estates, Old Cutler Bay, and Pinecrest ultra-luxury inventory.
- ZIP 33133 (Coconut Grove): 15 closed at median $3,300,000, $/sqft $1,066, 44 DOM, 96 percent SP/LP, 53 percent cash, median year built 1971, 27 percent waterfront. 9 active, 1.8 MOI. Cleveland Park, Entrada, Bay Heights, and other Coconut Grove sub-communities.
Note on scope: "Coral Gables area" here includes Pinecrest (33156) and Coconut Grove (33133), which technically are separate cities but function as adjacent markets in the same buyer decision set. Buyers evaluating "Coral Gables" often also consider Pinecrest and Coconut Grove. For narrower City of Coral Gables proper analysis, focus on 33134 and 33146.
For deeper Coral Gables area analysis, see the Coral Gables Area Market Report July 2026.
The Pricing Divergence: 127% Premium Story
Coral Gables area median sale price of $2,300,000 is 127 percent higher than Doral's $1,012,500. Median $/sqft of $941 is 130 percent higher than Doral's $409. Both premiums have consistent explanations:
1. Historic character premium. A well-preserved 1950s Mediterranean home in a Coral Gables Section commands premium pricing because the architectural language, curated streetscape, and neighborhood consistency cannot be replicated. Coral Gables' architectural review board ensures new construction and renovations maintain heritage character. This creates artificial scarcity that supports pricing.
2. Established landscaping and street presence. 100-year-old canopies of oak and banyan trees along Miracle Mile, Alhambra Circle, and Old Cutler Road cannot be planted quickly. Newer markets like Doral cannot replicate this feature. It shows up in curb appeal, aerial views, and neighborhood identity.
3. Concentrated wealth. Coral Gables (population ~50,000) hosts a disproportionate share of Miami-Dade's high-net-worth residents. The University of Miami's proximity, established professional community, and multigenerational family presence all contribute to premium pricing. This is reflected in the 55 percent cash share (vs Doral's 19 percent).
4. Lot sizes and density patterns. Coral Gables Core (Sections A-E) has larger lots on curved streets than Doral's typically-denser subdivisions. The land component of price is meaningfully higher in Coral Gables.
5. Ultra-luxury tier presence. Coral Gables area price range reaches $47 million (Gables Estates), versus Doral's $3.65 million maximum. The presence of ultra-luxury tier inventory pulls the mean and median upward in the Coral Gables sample.
The Cash Story: 55% vs 19% Buyer Composition
Cash share is the single most divergent metric between the two markets: 55 percent for Coral Gables area versus 19 percent for Doral. This is not noise; it reflects structural differences in buyer composition.
Coral Gables cash-heavy dynamics:
- High-net-worth domestic buyers with existing US dollar liquidity available for deployment
- International buyers, particularly Latin American, transacting cash through Florida land trusts and foreign corporations for tax and privacy planning
- Ultra-luxury tier ($5M+) where jumbo mortgage math strongly favors cash deployment (68 percent cash in Pinecrest 33156)
- Multi-generational wealth transfer transactions within Coral Gables' established family base
Doral financed-buyer dynamics:
- Move-up buyers from smaller Doral condos or from outside Doral into Doral single-family homes, typically financing
- Relocation buyers from corporate transfers or professional moves, often qualifying for financing but still competing with some cash offers
- Entry-luxury tier ($700K-$1.5M) where jumbo mortgage math is more viable than at $2M+ tiers
- Younger buyer demographics in a newer city where the multi-generational wealth base has not accumulated as it has in Coral Gables
For buyers, this means Coral Gables competition looks different from Doral competition. In Coral Gables, financed offers face substantial cash competition and need strong structure (shorter contingency windows, full underwriting, appraisal flexibility). In Doral, financed offers are more competitive because they represent the majority of the buyer pool.
For deeper coverage of the cash share dynamics, see Selling Your Miami Home to International or Cash Buyers.
Construction Age: 44-Year Median Build Gap
Median year built in Coral Gables area closed sales is 1958. Median year built in Doral closed sales is 2002. The 44-year gap has substantial practical implications:
Coral Gables (median 1958, range 1922-2026):
- Original Mediterranean Revival, mid-century, and 1970s-1980s architecture predominates
- Renovation is common; many closings represent substantially updated homes with modern systems inside original shells
- Roof, HVAC, plumbing, and electrical age is a specific due-diligence item on every property
- Hurricane impact windows retrofitted (or scheduled for retrofit) rather than original
- Insurance underwriting more complex for older homes without recent updates
- Character premium reflected in $/sqft, but maintenance burden reflected in ownership economics
- New construction (2020s) does exist in Coral Gables but represents small share of inventory
Doral (median 2002, range 1984-2025):
- Modern construction with current-code hurricane impact, modern electrical, plumbing, and HVAC systems
- Newer construction warranties still active on many properties (particularly Downtown Doral South and newer Doral Isles phases)
- Insurance underwriting cleaner and less costly for newer construction
- Contemporary open-concept floor plans standard
- Lower near-term maintenance burden; systems typically have decades of useful life remaining
- Original 1980s-1990s construction exists but is minority share of recently-closed inventory
Sub-Market Detail (By ZIP)
| Sub-market (ZIP) | Closed 90d | Median Price | $/sqft | DOM | SP/LP | Cash | MOI |
|---|---|---|---|---|---|---|---|
| DORAL SUB-MARKETS | |||||||
| Doral Core + Isles (33178) | 105 | $990,000 | $393 | 47 | 96% | 16% | 2.9 |
| Downtown Doral + Miami Springs (33166) | 21 | $1,100,000 | $488 | 42 | 96% | 29% | 2.3 |
| Doral / Fontainebleau (33172) | 8 | $767,500 | $438 | 9 | 99% | 38% | 1.9 |
| CORAL GABLES AREA SUB-MARKETS | |||||||
| Coral Gables Core (33134) | 95 | $1,845,000 | $892 | 42 | 95% | 53% | 2.2 |
| Coral Gables Riviera (33146) | 47 | $2,300,000 | $973 | 23 | 97% | 53% | 2.5 |
| Pinecrest / South CG (33156) | 28 | $6,390,000 | $1,406 | 108 | 92.5% | 68% | 3.3 |
| Coconut Grove (33133) | 15 | $3,300,000 | $1,066 | 44 | 96% | 53% | 1.8 |
Key observation: Coral Gables area sub-markets range from $1,845,000 (Core) to $6,390,000 (Pinecrest ultra-luxury tier) median. Doral sub-markets cluster tightly $767,500 to $1,100,000 median. The Coral Gables area's price band is meaningfully wider, with ultra-luxury tier depth that Doral does not currently have.
Carrying Costs and Investment Math
Total annual carrying cost differs meaningfully between the two markets:
| Cost | Doral | Coral Gables Area | Delta (annual) |
|---|---|---|---|
| HOA (monthly median) | $406 | $350 | Doral +$672/yr |
| HOA (annual) | $4,872 | $4,200 | - |
| Property tax (annual median) | $12,020 | $18,231 | CG +$6,211/yr |
| Combined annual carrying cost | $16,892 | $22,431 | CG +$5,539/yr |
Reading the numbers: Coral Gables carries approximately $5,500 more per year in HOA + property tax than Doral, driven by higher property tax on the higher assessed values. The HOA difference is small ($672 annually) because many Coral Gables historic homes are on non-HOA lots (unlike Doral where master-planned communities with HOAs dominate).
Note that assessed value resets to market value on the January 1 following purchase, so new buyer tax bills will be higher than current owner tax bills in both markets, particularly for long-term owners benefiting from Save Our Homes cap. For the full framework, see Tax Implications of Selling Your Doral or Miami Home.
The Buyer Profiles: Who Chooses Each
Typical Doral buyer profiles
- Corporate relocation professionals transferring to Doral for jobs at Carnival, Ryder, Univision, or other major Doral-based employers
- Latin American families establishing US bases with children in Downtown Doral Charter Schools, wanting newer construction with modern systems
- First-time luxury buyers stepping up from Doral condos into single-family homes, financing-eligible in the $800K-$1.5M range
- International buyers favoring newer construction over historic architecture, willing to accept less established neighborhoods for turnkey modern homes
- Younger families (median age of Doral is meaningfully younger than Coral Gables) wanting modern amenities and newer school infrastructure
Typical Coral Gables area buyer profiles
- Multi-generational Miami families upgrading within Coral Gables or moving from adjacent legacy neighborhoods
- University of Miami faculty and administration plus alumni professionals with long-term Coral Gables ties
- High-net-worth international buyers valuing historic architecture, established neighborhoods, and Coral Gables' international name recognition
- Cash-heavy domestic buyers deploying liquidity into premium historic real estate for long-term hold
- Ultra-luxury buyers ($5M+) in Pinecrest, Gables Estates, Old Cutler Road, and Coconut Grove bayfront
- Renovation buyers valuing historic character and willing to invest in updating original construction
Both buyer sets are legitimate and well-served in their respective markets. The choice is less about which is "better" and more about which matches the buyer's specific priorities and financial position.
Decision Framework: Which Suits You?
Choose Doral if you value:
- Newer construction with modern systems (median 2002 build, active builder warranties on newest inventory)
- Lower total price point ($1M median vs $2.3M Coral Gables median, 127 percent price differential)
- Lower $/sqft ($409 vs $941, 130 percent differential)
- Financed purchase competitiveness (19 percent cash competition vs 55 percent in Coral Gables)
- Lower annual carrying costs ($5,539 annual savings on HOA + tax vs Coral Gables)
- Modern master-planned community amenities (Doral Isles, Downtown Doral urban village)
- Established but younger city character (2003 incorporation, growth trajectory)
- Downtown Doral Charter School integration (available K-12 charter option within the Downtown Doral master plan)
Choose Coral Gables area if you value:
- Historic architectural character (Mediterranean Revival, mid-century preservation, established streetscapes)
- Ultra-luxury tier depth ($5M-$47M inventory in Pinecrest and adjacent, not available in Doral)
- Mature landscaping and established street presence (100-year-old canopies, curved historic streets)
- Concentrated wealth environment (55 percent cash share, established multi-generational buyer base)
- Cultural and educational institutions (University of Miami, Biltmore, Miracle Mile)
- Pool prevalence (55 percent of closings have pool, vs Doral 26 percent)
- Established international name recognition ("Coral Gables" is globally recognized in a way Doral is still building)
- Renovation opportunity (older construction with premium land value, upside for value-add buyers)
Many buyers tour both to compare directly before deciding. Reading data is one thing; walking Miracle Mile in Coral Gables versus walking Downtown Doral Park is a different experience. I recommend touring at least 3-5 properties in each market before committing to one direction.
Methodology and Data Sources
Data source: Miami-Dade Multiple Listing Service (MLS), pulled August 27-28, 2026. Doral sample includes single-family home transactions in ZIP codes 33178, 33166, and 33172. Coral Gables area sample includes single-family home transactions in ZIP codes 33134, 33146, 33156, and 33133.
Sample size: Doral: 134 closed sales, 123 active listings, 16 pending, 273 total records. Coral Gables area: 185 closed sales, 148 active listings, 20 pending, 354 total records. Combined sample: 319 closed transactions across both markets. Both samples are statistically robust for aggregate and sub-market analysis.
Scope note on "Coral Gables area": The Coral Gables area aggregate includes Pinecrest (33156) and Coconut Grove (33133) which are technically separate cities from City of Coral Gables proper. This convention reflects how buyers actually evaluate these adjacent luxury markets in the same decision set. For City of Coral Gables proper analysis, focus on ZIPs 33134 and 33146 only. Sub-market breakdown table provides this granularity.
Metric definitions: Median sale price = median of Sale Price for closed transactions. Median $/sqft = median of Current Price per SqFt. Median DOM = median days on market. Sale-to-list ratio = median of Sale Price divided by List Price. Cash share = percentage of closings marked "Cash" as financing type. Waterfront percentage = share marked "Yes" on Waterfront Property field. HOA converted to monthly equivalent. Months of inventory (MOI) = active listings divided by (closed sales in 90 days / 3).
External data references: Miami Association of Realtors statistics. Miami-Dade County Property Appraiser. City of Doral. City of Coral Gables.
Fair Housing note: This comparison focuses exclusively on property characteristics, transaction dynamics, market data, and community physical features. It does not reference or discuss demographic characteristics, school quality ratings, or any protected class characteristics.
Related Doral and Coral Gables Research
- Doral Market Report July 2026
- Coral Gables Area Market Report July 2026
- Downtown Doral vs Doral Isles Comparison
- Doral vs Coral Gables Luxury Real Estate (luxury-focused comparison)
- Waterfront Luxury Homes Miami & Doral Guide
- Selling Your Miami Home to International or Cash Buyers
- Tax Implications of Selling Your Doral or Miami Home
- Free Home Valuation for Your Doral or Coral Gables Address
Frequently Asked Questions
Ready to Tour Doral, Coral Gables, or Both?
I coordinate showings across both markets, pull property-specific comp analysis for any listing you are considering, and walk through the decision framework in-person. Bilingual EN/ES service, 300+ Miami-Dade transactions of direct experience.
Call or Text (786) 949-3971The Keyes Company · Exclusive Member of Forbes Global Properties · Founding Member of Luxury Portfolio International
15+ years · 300+ closed transactions · Bilingual EN/ES
4191 NW 107th Ave, Doral, FL 33178
elizabethcosta@keyes.com · Schedule a Consultation
Serving Doral, Miami, Coral Gables, Coconut Grove, and Pinecrest
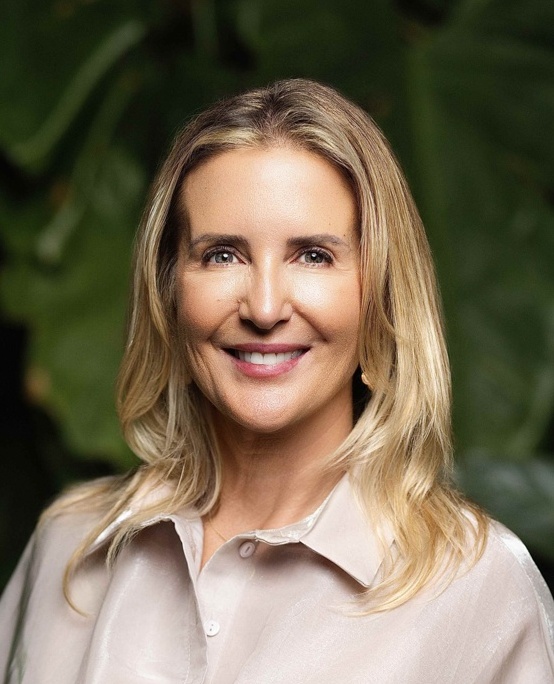 |
Elizabeth Costa, Realtor — FL Lic. #3234205 Top Real Estate Agent in Doral, Florida | The Keyes Company ☎ (786) 949-3971 ✉ elizabethcosta@keyes.com 📅 Schedule a private consultation 15+ years · 300+ closed transactions · Bilingual EN/ES Office: 4191 NW 107th Ave, Doral, FL 33178 Serving Doral, Miami, Coral Gables, Coconut Grove, and Pinecrest The Keyes Company: Exclusive Member of Forbes Global Properties · Founding Member of Luxury Portfolio International |