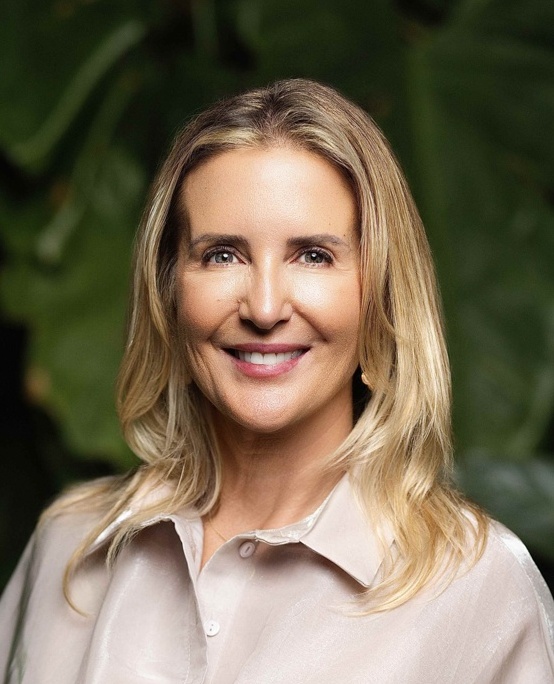
By Elizabeth Costa - Top Real Estate Agent in Doral, Florida | The Keyes Company
15+ years of experience · 300+ closed transactions · Bilingual: English & Spanish
Exclusive Member of Forbes Global Properties · Founding Member of Luxury Portfolio International
Coconut Grove vs Coral Gables: which Miami luxury community is better for buyers in 2026?
Coconut Grove (ZIP 33133, part of the City of Miami) and Coral Gables (ZIP 33134 + 33146, City of Coral Gables proper) are two of Miami's most distinct luxury communities, but they attract fundamentally different buyers. Based on Miami-Dade MLS data through August 28, 2026: Coconut Grove closed 15 single-family homes at a median $3,300,000 with median $1,066 per square foot, 53 percent cash share, 27 percent waterfront homes, median 44 days on market, and 1.8 months of inventory (tighter market). Coral Gables city proper closed 142 single-family homes at a median $1,940,000 with median $919 per square foot, 53 percent cash share, 6 percent waterfront homes, median 36 days on market, and 2.3 months of inventory. Coconut Grove attracts ultra-luxury bayfront buyers (trophy closings reached $16.35M on Sunrise Ct in Sunrise Harbour), while Coral Gables attracts historic Mediterranean Revival buyers across Sections B and E, the Country Club district, and the Riviera. Both are Strong Seller markets with identical 53 percent cash share. Coconut Grove offers waterfront lifestyle and ultra-luxury tier depth; Coral Gables offers historic architectural heritage and broader inventory at established price bands.
In This Comparison
- Coconut Grove vs Coral Gables at a Glance
- Coconut Grove Character: Bayfront Bohemian Luxury
- Coral Gables Character: Historic "City Beautiful"
- The Pricing Story: Coconut Grove 70% Premium
- Waterfront and Lifestyle Divergence
- 2026 Trophy Closings in Both Communities
- Sub-Communities Within Each Market
- Cash Market Dynamics (Both at 53%)
- Carrying Costs and Ownership Math
- Buyer Profiles: Who Chooses Each
- Decision Framework: Which Suits You?
- Methodology and Data Sources
- Frequently Asked Questions
Coconut Grove vs Coral Gables is one of Miami luxury's most consequential decisions, and it comes up regularly in relocation and second-home consultations I have. Both are historic, distinct, sought-after communities. Both attract high-net-worth domestic and international buyers. But they represent categorically different value propositions: Coconut Grove is bayfront-focused bohemian luxury with an oak-shaded creative energy and ultra-luxury waterfront tier depth reaching $16 million and above. Coral Gables is Merrick's Mediterranean Revival "City Beautiful" with 100-year-old preserved historic architecture and broader luxury inventory concentrated inland.
I am Elizabeth Costa, a Realtor with The Keyes Company. I work transactions across both communities. This guide is the complete side-by-side comparison based on Miami-Dade MLS data through August 28, 2026, with a decision framework, trophy closing analysis, and buyer profile matching.
Coconut Grove vs Coral Gables at a Glance
| Dimension | Coconut Grove (33133) | Coral Gables (33134+33146) | Delta |
|---|---|---|---|
| Closed sales (90d) | 15 | 142 | CG 9.5x volume |
| Median sale price | $3,300,000 | $1,940,000 | Grove +70% |
| Price range | $680K - $16.35M | $610K - $8.0M | Grove 2x top |
| Median $/sqft | $1,066 | $919 | Grove +16% |
| Median SqFt Living | 2,481 | 2,209 | Grove +12% |
| Median year built | 1971 | 1954 | 17 years newer |
| Median DOM | 44 days | 36 days | CG faster |
| Sale-to-list ratio | 96.0% | 95.0% | Grove +1pp |
| Cash share | 53% | 53% | Identical |
| Waterfront % | 27% | 6% | Grove 4.5x |
| Pool % | 67% | 46% | Grove +21pp |
| Median annual tax | $23,258 | $15,310 | Grove +52% |
| Active inventory | 9 | 108 | CG 12x volume |
| Median active list | $3,750,000 | $2,073,500 | Grove +81% |
| MOI (Strong Seller <3) | 1.8 (tighter) | 2.3 | Grove tighter |
The 90-second read: Coconut Grove trades at a 70 percent premium to Coral Gables on median price, driven by waterfront concentration (27 percent of Coconut Grove closings are waterfront vs 6 percent Coral Gables) and ultra-luxury tier depth ($16.35M top close vs $8M top close). Coral Gables offers 9.5x the transaction volume and broader inventory at more accessible luxury price bands. Both share identical 53 percent cash share and similar sale-to-list dynamics. Coconut Grove is meaningfully tighter (1.8 MOI vs 2.3).
Coconut Grove Character: Bayfront Bohemian Luxury
Coconut Grove is technically part of the City of Miami, but the community operates with its own distinct identity. Founded in the 1870s as one of the earliest settlements in what would become Miami, "The Grove" preserves a tropical, oak-canopied, artistic character that has attracted writers, sailors, architects, and creative professionals for over a century.
Physical character
Coconut Grove sits along Biscayne Bay south of Downtown Miami. Sunrise Harbour, Bay Heights, Cleveland Park, Fairhaven, Entrada, King Park, and Ocean View Heights are among the sub-communities where 2026 luxury transactions concentrated. Streets are curved and canopied under mature banyan and oak. Waterfront properties command significant premiums, with 27 percent of recent closings on waterfront lots (compared to 6 percent in Coral Gables).
Cultural character
Coconut Grove is home to the annual Coconut Grove Arts Festival, Vizcaya Museum and Gardens, the Grove Village retail district, CocoWalk, and Peacock Park. The community has historically attracted artists, sailors, and creative professionals in addition to traditional luxury real estate buyers.
Recent price action
Median 2026 closed sale is $3,300,000 with median $/sqft of $1,066. The market has ultra-luxury tier depth: multiple 2026 closings above $10 million occurred in Sunrise Harbour, and one property closed at $16,350,000. Median year built is 1971, meaningfully newer than Coral Gables' 1954 median, reflecting waterfront development activity of the 1960s-1980s.
Coral Gables Character: Historic "City Beautiful"
Coral Gables (City of Coral Gables proper, ZIPs 33134 + 33146) was founded by George Merrick in 1925 as one of the earliest master-planned "New Towns" in the United States. Merrick's vision, executed with architect Denman Fink and landscape architect Frank Button, was a Mediterranean Revival "City Beautiful" with curved streets, distinctive plazas, iconic entrances, and consistent Mediterranean architectural language.
Historic sections
Coral Gables Sections A through E (Coral Gables Sec B, Sec E, Riviera Sec, Country Club, Granada Sec, Biltmore) contain some of Miami-Dade's most preserved historic residential inventory. The Merrick Estate designation and city architectural review board protect heritage character. Curved streets like Alhambra Circle, Granada Boulevard, and Riviera Drive maintain their 1920s-1930s design language.
Cultural institutions
The University of Miami relocated to Coral Gables in 1926 and remains the community's cultural anchor. The Biltmore Hotel (National Historic Landmark) opened the same year. Miracle Mile serves as the city's downtown commercial spine. Venetian Pool, Coral Gables Museum, and the Colonnade preserve civic identity.
Recent price action
Median 2026 closed sale is $1,940,000 with median $/sqft of $919. Transaction volume is meaningfully higher than Coconut Grove (142 vs 15 closings in 90 days), reflecting the larger geographic footprint and broader inventory. Top 2026 closings ranged from $5.6 million to $8 million, dominated by Country Club, Riviera, and Section B properties. Median year built is 1954, reflecting the mid-century preservation of Merrick-era architecture.
The Pricing Story: Coconut Grove 70% Premium
Coconut Grove median sale price of $3,300,000 is 70 percent higher than Coral Gables' $1,940,000. Median $/sqft is 16 percent higher ($1,066 vs $919). This premium has consistent structural drivers:
1. Waterfront concentration. 27 percent of Coconut Grove closings are waterfront versus 6 percent in Coral Gables. Waterfront homes typically command 50-100+ percent premiums over comparable non-waterfront inventory. This is the single largest driver of the median divergence.
2. Ultra-luxury tier depth. Coconut Grove closings reached $16.35 million (Sunrise Ct in Sunrise Harbour) in the 90-day sample. Coral Gables top close was $8 million. Ultra-luxury weighting pulls Coconut Grove's aggregate median upward.
3. Newer construction. Median year built 1971 in Coconut Grove vs 1954 in Coral Gables. Newer inventory typically commands premiums for modern systems, contemporary layouts, and cleaner insurance underwriting.
4. Pool prevalence. 67 percent of Coconut Grove closings have pools vs 46 percent Coral Gables. Waterfront + pool combinations are a significant part of the Coconut Grove luxury proposition.
5. Larger median SqFt. Coconut Grove median 2,481 sqft vs Coral Gables 2,209 sqft. Slightly larger homes at slightly higher $/sqft compound into meaningful price divergence.
Waterfront and Lifestyle Divergence
The single most defining structural difference between these two communities is waterfront access:
- Coconut Grove: 27 percent of closed sales are waterfront (4 of 15). Bayfront and canal access along Biscayne Bay. Sailing culture with multiple marinas.
- Coral Gables: 6 percent of closed sales are waterfront (8 of 142). Waterfront in Coral Gables is primarily via the Cocoplum Waterway, Gables Waterway, and small canal accesses, not the direct bayfront that Coconut Grove offers.
The difference goes beyond percentages. Coconut Grove's waterfront is dramatic bayfront with direct water access, boat dockage, and long views. Coral Gables' waterfront is more contained interior waterway. If waterfront is a priority, Coconut Grove is the clear direction. If waterfront is not a specific requirement, Coral Gables' historic character offers a comparable luxury experience at lower price points.
For deeper waterfront coverage, see Waterfront Luxury Homes Miami & Doral Guide.
2026 Trophy Closings in Both Communities
Coconut Grove top 2026 closings (through August 28)
- $16.35 million on Sunrise Ct in Sunrise Harbour
- $16.30 million on Sunrise Ct in Sunrise Harbour
- $13.00 million on Sunrise Dr in Sunrise Harbour
- $8.05 million on Sunrise Pl in Sunrise Harbour
- $4.60 million on N Prospect Dr in Sans Souci
Sunrise Harbour concentration: Four of the top five Coconut Grove closings in 2026 occurred in Sunrise Harbour, one of the community's most exclusive bayfront sub-communities. This concentration reflects Sunrise Harbour's positioning as the ultra-luxury tier of Coconut Grove.
Coral Gables top 2026 closings (through August 28)
- $8.00 million on Riviera Dr in Coral Gables Riviera Section
- $7.60 million on Mariola Court in Coral Gables Country Club
- $7.25 million on Granada Blvd in Coral Gables Country Club Sec 4
- $5.80 million on Castile Plaza in Coral Gables Section B
- $5.625 million on Alhambra Circle in Coral Gables Section E
Country Club and Riviera dominance: Coral Gables top closings concentrate in the Country Club district (Mariola Court, Granada Blvd) and Riviera Section, reflecting these sub-communities' luxury positioning within the historic city.
All addresses referenced by street name and community per Miami-Dade MLS public data, with house numbers omitted for seller privacy post-close.
Sub-Communities Within Each Market
Coconut Grove sub-communities (2026 activity)
- Sunrise Harbour (4 closings): Ultra-luxury bayfront tier, most active sub-community
- Sunrise (Amended and Corrected Plat) (3 closings): Adjacent to Sunrise Harbour, bayfront
- MacFarlane Homestead (3 closings): Historic Coconut Grove neighborhood
- Sans Souci (2 closings): Established Coconut Grove sub-community
- Coconut Grove Manor, Golden Gate (1 each): Additional Coconut Grove sub-communities with recent activity
Coral Gables sub-communities (2026 activity)
- Coral Gables Riviera Section (21 closings): Most active sub-community; includes Section 3 Rev, Section 10, and Section Part 2 Rev
- Coral Gables Granada Section (19 closings): Historic Granada corridor, second most active
- Coral Gables Country Club (12 closings, plus Country Club Sec 3, 4, 6): Historic Country Club district, home to most top-tier trophy closings
- Coral Gables Section B (9 closings): Historic Section B
- Coral Gables Section E (8 closings): Historic Section E along Alhambra Circle
- Coconut Grove Section 1 Coral Gables (5 closings): Coral Gables sub-community bordering Coconut Grove
- Coral Groves, Biltmore Section, and smaller subsections: Distributed remaining activity
Coral Gables' sub-community structure is more granular and diverse, reflecting the larger geographic footprint and 100 years of neighborhood evolution within the master-planned city.
Cash Market Dynamics (Both at 53%)
Both communities close 53 percent cash in the 2026 sample. This near-identical cash share reflects a shared buyer pool: high-net-worth domestic buyers, international buyers, and luxury tier deployment favor cash regardless of specific community. Both markets serve buyers with liquidity above $1M-$3M, and jumbo mortgage math discourages financing at these price tiers.
Implications for financed buyers: Both markets present the same challenge for financed buyers, roughly half of your competition will be cash. Structural response is the same:
- Full underwriting pre-approval (not just pre-qualification)
- Shorter financing contingency windows
- Appraisal flexibility strategy (appraisal gap coverage where appropriate)
- Larger earnest money deposits to signal seriousness
- Faster inspection resolution
For deeper coverage of cash vs financed buyer dynamics, see Selling Your Miami Home to International or Cash Buyers.
Carrying Costs and Ownership Math
Ownership economics differ meaningfully between the two communities:
| Cost | Coconut Grove | Coral Gables | Delta (annual) |
|---|---|---|---|
| Property tax (annual median) | $23,258 | $15,310 | Grove +$7,948/yr |
| HOA (many CG properties non-HOA) | $300/mo (median) | $0 (most non-HOA) | Grove +$3,600/yr |
| Combined annual carrying cost estimate | ~$26,858 | ~$15,310 | Grove +$11,548/yr |
Key insight: Coconut Grove's higher property tax reflects the higher assessed values (higher home prices + waterfront premiums). Coconut Grove's HOA prevalence reflects gated sub-communities like Sunrise Harbour and Sans Souci that maintain private amenities. Coral Gables' historic homes are largely non-HOA fee simple ownership on Merrick-era platted lots.
For the full framework on property tax, homestead portability, and closing tax outcomes, see Tax Implications of Selling Your Doral or Miami Home.
Buyer Profiles: Who Chooses Each
Typical Coconut Grove buyer profiles
- Waterfront luxury buyers seeking direct bayfront living with dockage and long views
- Ultra-luxury buyers ($5M+, particularly $10M+) drawn to Sunrise Harbour and similar exclusive sub-communities
- Sailing and boating enthusiasts valuing Coconut Grove's marina culture and immediate bay access
- Creative professionals and artists attracted to the community's bohemian, oak-canopied character
- International buyers favoring the recognized Coconut Grove name and Miami bayfront identity
- Second-home buyers seeking Miami waterfront for seasonal or investment purposes
Typical Coral Gables buyer profiles
- Historic architecture appreciators valuing Mediterranean Revival preserved character
- Multi-generational Coral Gables families upgrading or moving within the historic city
- University of Miami-affiliated buyers (faculty, administration, alumni, professional community)
- Broader luxury buyer pool comfortable at $1.5M-$4M entry to mid-luxury tiers
- Renovation buyers valuing historic character with renovation opportunity in original construction
- Buyers preferring inland historic city over bayfront for lifestyle reasons (school proximity, walkability to Miracle Mile, established neighborhood consistency)
Decision Framework: Which Suits You?
Choose Coconut Grove if you value:
- Waterfront living (27 percent of closings vs 6 percent Coral Gables)
- Ultra-luxury tier depth ($10M-$16M+ inventory)
- Bayfront lifestyle with immediate boat and marina access
- Newer luxury construction (1971 median build vs 1954)
- Pool prevalence (67 percent of closings)
- Bohemian, artistic community character
- Higher acceptance of tighter inventory (1.8 MOI, be prepared to move fast)
- Higher price and carrying cost ($3.3M median, $23K+ annual tax)
Choose Coral Gables if you value:
- Historic Mediterranean Revival architecture preserved across Sections A-E and Riviera
- Broader inventory selection (142 recent closings vs 15 in Coconut Grove)
- More accessible luxury price bands ($1.5M-$3M mid-luxury tier well-represented)
- City infrastructure (Miracle Mile, Biltmore, University of Miami, cultural institutions)
- Non-HOA ownership (many CG historic homes are fee simple without HOA fees)
- Established neighborhoods with consistent architectural character
- Lower property tax and carrying cost at similar entry-luxury price points
- Renovation upside potential in historic homes
Methodology and Data Sources
Data source: Miami-Dade Multiple Listing Service (MLS), pulled August 28, 2026. Coconut Grove sample includes all single-family home transactions in ZIP 33133. Coral Gables sample includes single-family home transactions in ZIPs 33134 and 33146 (City of Coral Gables proper, excluding Pinecrest 33156 which is a separate city).
Sample size: Coconut Grove: 15 closed sales, 9 active listings, 1 pending (25 total records). Coral Gables city: 142 closed sales, 108 active listings, 18 pending (269 total records). Coconut Grove sample is smaller due to lower transaction volume in a compact geographic area. Coral Gables sample is statistically robust across a wider geographic footprint.
Scope note: Coconut Grove is technically a neighborhood within the City of Miami, not a separate city. Coral Gables is a separate incorporated city. The comparison reflects how buyers evaluate the two markets in the same decision set based on real estate character, not on municipal governance.
Metric definitions: Median sale price = median of Sale Price for closed transactions. Median $/sqft = median of Current Price per SqFt. Median DOM = median days on market. Sale-to-list ratio = median of Sale Price divided by List Price. Cash share = percentage of closings marked "Cash" as financing type. Waterfront percentage = share marked "Yes" on Waterfront Property field. Months of inventory (MOI) = active listings divided by (closed sales in 90 days / 3).
Address privacy: Trophy closings referenced by street and community name only. House numbers omitted for seller privacy post-close.
External data references: Miami Association of Realtors statistics. Miami-Dade County Property Appraiser. City of Coral Gables.
Fair Housing note: Comparison focuses on property characteristics, transaction dynamics, market data, and community physical features only. No demographic, school, or protected class references.
Related Miami Luxury Research
- Coral Gables Area Market Report July 2026
- Doral vs Coral Gables Comparison 2026
- Waterfront Luxury Homes Miami & Doral Guide
- Doral vs Coral Gables Luxury Real Estate
- The Discreet Sale: Off-Market Luxury Real Estate
- Buying Luxury Real Estate in Miami as an International Buyer
- Global Network Reach for Selling Miami Luxury
- Free Home Valuation for Your Coconut Grove or Coral Gables Address
Frequently Asked Questions
Ready to Tour Coconut Grove, Coral Gables, or Both?
I coordinate showings across both communities, pull property-specific comp analysis for any listing, and walk through the decision framework in-person. Access to Forbes Global Properties + Luxury Portfolio International network for ultra-luxury inquiries. Bilingual EN/ES service.
Call or Text (786) 949-3971The Keyes Company · Exclusive Member of Forbes Global Properties · Founding Member of Luxury Portfolio International
15+ years · 300+ closed transactions · Bilingual EN/ES
elizabethcosta@keyes.com · Schedule a Consultation
Serving Doral, Miami, Coral Gables, Coconut Grove, and Pinecrest
![]() |
Elizabeth Costa, Realtor — FL Lic. #3234205 Top Real Estate Agent in Doral, Florida | The Keyes Company ☎ (786) 949-3971 ✉ elizabethcosta@keyes.com 📅 Schedule a private consultation 15+ years · 300+ closed transactions · Bilingual EN/ES Office: 4191 NW 107th Ave, Doral, FL 33178 Serving Doral, Miami, Coral Gables, Coconut Grove, and Pinecrest The Keyes Company: Exclusive Member of Forbes Global Properties · Founding Member of Luxury Portfolio International |