


By Elizabeth Costa - Top Real Estate Agent in Doral, Florida | The Keyes Company
15+ years of experience · 300+ closed transactions · Bilingual: English & Spanish
Exclusive Member of Forbes Global Properties · Founding Member of Luxury Portfolio International
What did the Coral Gables area single-family home market do in August 2026?
Across the four Coral Gables area ZIP codes (33134, 33146, 33156, 33133), 76 single-family homes closed in August 2026 at a median $2,312,500, down 7.5 percent from July's $2,500,000 median, with median 35 days on market (faster than July), 95 percent sale-to-list ratio, and 57 percent cash share (up from 55 percent 90-day baseline). Over the 90-day June 5 to September 2 window, Coral Gables area aggregate closed 232 single-family homes at a median $2,236,111, median $867 per square foot, 42-day median days on market, 51 percent cash share, 7 percent waterfront, 62 percent pool prevalence, and 2.2 months of inventory (Strong Seller conditions). Four sub-markets: Coral Gables Core (33134) $1.285M median at 1.8 MOI (tightest); Coral Gables Riviera (33146) $2.08M median with 10-day median DOM (fastest); Pinecrest / South Coral Gables (33156) $2.85M median with continued ultra-luxury tier activity; and Coconut Grove (33133) $2.6625M median at 1.9 MOI. Trophy August closings continued to concentrate in Pinecrest ($20.5M+ Old Cutler Bay) and Coconut Grove ($16.35M+ Sunrise Harbour).
In This Report
- Coral Gables Area Aggregate August 2026 Snapshot
- August 2026 Spotlight vs 90-Day Baseline
- Sub-Market Breakdown by ZIP
- Top August 2026 Trophy Closings
- Cash Share at 57% August (Highest in Miami-Dade)
- July 2026 vs August 2026 Comparison
- What This Means for Sellers
- What This Means for Buyers
- Ultra-Luxury Tier and Forbes Global Properties Network
- Signals to Watch for September and Q3 Close
- Methodology and Data Sources
- Frequently Asked Questions
This report covers single-family home activity across the four Coral Gables area ZIP codes (33134, 33146, 33156, 33133) for August 2026, with 90-day rolling context from June through August and comparative reference to the July 2026 report. It uses statistically robust methodology (232 total closings analyzed), breaks the data down by sub-market including ultra-luxury tier trophy closings, and identifies signals for September and Q3 close.
I am Elizabeth Costa, a Realtor with The Keyes Company. Through Keyes' Exclusive Member status with Forbes Global Properties and Founding Member status with Luxury Portfolio International, I have direct access to the invitation-only luxury networks that reach the ultra-luxury buyer pool for Pinecrest, Coconut Grove, and Coral Gables area transactions.
Coral Gables Area Aggregate August 2026 Snapshot
| Metric | August 2026 | 90-Day (Jun-Aug) | Direction |
|---|---|---|---|
| Closed sales | 76 | 232 | Stable pace |
| Median sale price | $2,312,500 | $2,236,111 | Slightly higher |
| Median $/sqft | $871 | $867 | Stable |
| Median days on market | 35 | 42 | Faster |
| Median sale-to-list ratio | 95.0% | 95.0% | Stable |
| Cash share | 57% | 51% | Up (+2pp) |
| Pool % | 62% | 62% | Stable |
| Active inventory | 170 | 170 | Stable |
| Pending sales | 95 | 95 | Strong pipeline |
Aggregate takeaways: 76 August closings represents consistent monthly velocity (June 78, July 77, August 76). Median price up slightly from 90-day baseline ($2.31M vs $2.24M). DOM notably faster in August (35 vs 42 90-day baseline), suggesting properties that closed in August had shorter marketing periods than the summer average. Cash share up modestly to 57 percent (from 51 percent baseline). Pending sales at 95 is a strong pipeline going into September, suggesting Q3 close will remain robust.
Aggregate months of inventory (MOI) sits at 2.2, firmly in Strong Seller's territory (under 3 months).
August 2026 Spotlight vs 90-Day Baseline
August 2026 shows Coral Gables area consistency:
- Volume stable at 76 closings (June 78, July 77, August 76 — remarkably consistent monthly cadence)
- Median price modestly higher ($2.31M vs $2.24M baseline, +3.4%)
- DOM materially faster (35 days August vs 42 90-day median) — a positive signal for sellers
- Cash share up modestly (57% August vs 51% baseline, +6 pp)
- Sale-to-list ratio stable at 95 percent
The faster DOM in August is the most positive August signal for sellers. Properties are closing more quickly than the summer average, indicating engaged buyer pool. Combined with 95 pending sales, September closed count should remain strong.
Sub-Market Breakdown by ZIP
| Sub-Market (ZIP) | Closed 90d | Median Price | $/sqft | DOM | Cash | MOI |
|---|---|---|---|---|---|---|
| Coral Gables Core (33134) | 63 | $1,285,000 | $772 | 43 | 48% | 1.8 (Strong Seller · tightest) |
| Coral Gables Riviera (33146) | 13 | $2,080,000 | $1,026 | 10 (fastest) | 54% | 4.2 (Balanced) |
| Pinecrest / South CG (33156) | 88 | $2,850,000 | $804 | 49 | 49% | 2.5 |
| Coconut Grove (33133) | 68 | $2,662,500 | $1,079 | 41 | 57% | 1.9 |
Sub-market observations:
Coral Gables Core (33134): Highest closed volume in sub-markets (63) with 1.8 MOI Strong Seller conditions (tightest sub-market). Median $1,285,000 makes this the corridor's most accessible entry-luxury tier. Cash share 48 percent reflects broader buyer pool including move-up families.
Coral Gables Riviera (33146): Small sample (13 closings) but notable 10-day median DOM (fastest in Miami-Dade). Median $2,080,000 with $1,026 $/sqft (highest in Coral Gables area). 4.2 MOI is Balanced (largest inventory-to-sales ratio in the corridor).
Pinecrest / South Coral Gables (33156): Largest closed volume (88), including ultra-luxury tier trophy closings. Median $2,850,000 reflects estate-tier weighting. 49 percent cash share consistent with ultra-luxury pool. 2.5 MOI.
Coconut Grove (33133): 68 closings at $2,662,500 median. Highest $/sqft in group at $1,079 reflecting Coconut Grove waterfront and Sunrise Harbour ultra-luxury tier. 57 percent cash share (highest of Coral Gables area sub-markets). 1.9 MOI tight.
Top August 2026 Trophy Closings
The Coral Gables area continues to deliver ultra-luxury trophy closings in August 2026:
- $22,500,000 on Kiaora St in Cleveland Park (Coconut Grove, 33133)
- $20,500,000 on Balada St in Old Cutler Bay Sec 2 (Pinecrest, 33156)
- $17,500,000 on Old Cutler Rd (Pinecrest 33156, Unplatted)
- $16,350,000 on Sunrise Ct in Sunrise Harbour (Coconut Grove, 33133)
Note on 33156 outlier: One 33156 closing showed $173,370,070 (SW 100th St, Continental Park subdivision). This transaction is likely a portfolio sale, land assemblage, or commercial redevelopment site rather than a typical single-family residential transaction and is excluded from trophy analysis pending further verification. Directional interpretation focuses on the trophy tier of confirmed single-family residential closings.
Ultra-luxury geographic concentration: Coconut Grove (Cleveland Park, Sunrise Harbour) and Pinecrest (Old Cutler Bay) continue to dominate the ultra-luxury tier. Both are prime territory for Forbes Global Properties invitation-only network representation and Luxury Portfolio International distribution.
All addresses referenced by street name and community per Miami-Dade MLS public data, with house numbers omitted for seller privacy post-close.
Cash Share at 57% August (Highest in Miami-Dade)
Coral Gables area cash share of 57 percent in August is among the highest of any Miami-Dade market. By sub-market:
- Coconut Grove (33133): 57 percent cash (aggregate 90-day)
- Coral Gables Riviera (33146): 54 percent cash
- Pinecrest / South CG (33156): 49 percent cash
- Coral Gables Core (33134): 48 percent cash
All sub-markets exceed 45 percent cash share, meaningfully higher than Doral (21 percent 90-day baseline) and reflecting the concentrated wealth of the Coral Gables corridor. Buyers here typically have deployment capital and prefer to close cash rather than deal with jumbo mortgage math at $1.5M+ price tiers.
For financed buyers: Structural competition dynamics in the Coral Gables area require stronger offer packages than in Doral. Full underwriting pre-approval, shorter contingency windows, appraisal flexibility, and larger earnest money deposits are all appropriate structural responses.
For deeper coverage of cash and international buyer dynamics, see Selling Your Miami Home to International or Cash Buyers.
July 2026 vs August 2026 Comparison
| Metric | July 2026 | August 2026 | Delta |
|---|---|---|---|
| Closed sales | 77 | 76 | Stable |
| Median sale price | $2,500,000 | $2,312,500 | -7.5% |
| Median DOM | 41 | 35 | -6 days (faster) |
| Sale-to-list ratio | 95.0% | 95.0% | Stable |
| Cash share | 55% | 57% | +2 pp |
Reading the comparison: Volume stable (77 vs 76). Median price down 7.5 percent, likely mix-effect (July had heavier ultra-luxury weighting from Coconut Grove and Pinecrest specific trophy closings). DOM faster in August (35 vs 41 days), positive seller signal. Cash share up modestly. See Coral Gables Area Market Report July 2026 for full July context.
What This Means for Sellers
1. DOM improvement is positive. August's 35-day median DOM (vs 42 baseline) means properties are closing faster, indicating engaged buyer pool. If you list now with correct pricing, expect reasonable timeline to accepted offer.
2. Sub-market strategy differs. Coral Gables Core (33134) at 1.8 MOI Strong Seller supports firmer pricing. Coral Gables Riviera (33146) at 4.2 MOI Balanced requires more strategic pricing to comps rather than to top of active range. Pinecrest (33156) and Coconut Grove (33133) each require tier-specific approach given ultra-luxury inventory presence.
3. Cash-buyer expectation is baseline. Half or more of your buyer pool will be cash. Prepare listing accordingly: clean disclosures, no appraisal risk red flags, readiness for 15-30 day close.
4. Ultra-luxury tier requires network representation. If your property is $5M+, marketing through Forbes Global Properties (invitation-only) and Luxury Portfolio International (founding-member cooperative) is meaningfully more consequential than public portal syndication. See the Forbes network section below.
What This Means for Buyers
1. Coral Gables Core (33134) is where entry-luxury financed buyers should focus first. $1,285,000 median, 48 percent cash share (leaving majority for financed buyers), 1.8 MOI Strong Seller. Move quickly on matching properties.
2. Riviera (33146) offers fast turnover. 10-day median DOM. If a matching property appears, be ready to move within days.
3. Pinecrest and Coconut Grove are ultra-luxury territory. Financed offers face substantial cash competition. Consider full underwriting pre-approval, appraisal flexibility, and network representation on the buyer side.
4. September pipeline is strong. 95 pending sales going into September. Some competitive properties may become available as inventory refreshes.
Ultra-Luxury Tier and Forbes Global Properties Network
At ultra-luxury tier ($5M+), invitation-only luxury networks provide the distribution infrastructure that reaches the actual buyer pool. The Coral Gables area's Pinecrest and Coconut Grove sub-communities regularly see $10M+ and $20M+ closings that operate on these network channels rather than public real estate portals.
The Keyes Company holds documented membership in the two most authoritative US luxury real estate networks:
- Exclusive Member of Forbes Global Properties — invitation-only association of luxury real estate experts reaching Forbes' 140 million global audience across 69+ countries with 53M+ social media footprint. Includes Private Office discreet listing service.
- Founding Member of Luxury Portfolio International — luxury division of Leading Real Estate Companies of the World. Connects $1M+ properties to top-tier professionals in 70+ countries and 800+ major cities. Average viewer $10.3M+ liquid assets.
For Coral Gables area luxury sellers, Keyes network access means listings receive documented distribution infrastructure that competing brokerages cannot match. For deeper detail, see Global Network Reach for Selling Doral & Miami Luxury.
Signals to Watch for September and Q3 Close
Three signals I will be tracking in September:
Pending-to-closed conversion. 95 pending sales going into September. Typical conversion 85-95 percent within 30-60 days. September closings should remain robust.
Ultra-luxury tier activity continuity. Does Pinecrest and Coconut Grove ultra-luxury flow continue at August pace? Key barometer for the corridor.
DOM velocity. Did August's 35-day median DOM reflect a durable buyer engagement improvement, or was it monthly variance? September DOM data confirms.
Methodology and Data Sources
Data source: Miami-Dade Multiple Listing Service (MLS), pulled September 3, 2026. Sample includes all single-family home transactions with closing dates between June 5 and September 2, 2026, in ZIP codes 33134, 33146, 33156, and 33133.
Sample size: 232 closed sales, 170 active listings, 95 pending across all four Coral Gables area ZIPs. Statistically robust for aggregate and sub-market analysis.
Scope note on "Coral Gables area": Includes Pinecrest (33156) and Coconut Grove (33133) which are technically separate cities from City of Coral Gables proper. Convention reflects how buyers evaluate these adjacent luxury markets in the same decision set.
Outlier note: One 33156 closing showed $173,370,070 (SW 100th St, Continental Park). This is excluded from trophy analysis pending further verification, as it likely represents a portfolio sale, land assemblage, or commercial redevelopment rather than typical single-family residential transaction. All other reported statistics include this closing in aggregate median calculations to preserve data integrity, but flagged for context.
Metric definitions: Median sale price = median of Sale Price for closed transactions. Median $/sqft = median of Current Price per SqFt. Median DOM = median days on market. Sale-to-list ratio = median of Sale Price divided by List Price. Cash share = percentage of closings marked "Cash" as financing type. Months of inventory (MOI) = active listings divided by (closed sales in 90 days / 3).
Address privacy: Trophy closings referenced by street and community per Miami-Dade MLS public data, with house numbers omitted for seller privacy post-close.
External data references: Miami Association of Realtors statistics. Miami-Dade County Property Appraiser. City of Coral Gables.
Related Coral Gables and Miami Research
- Coral Gables Area Market Report July 2026
- Doral Market Report August 2026 (companion Miami-Dade market)
- Doral vs Coral Gables Comparison 2026
- Coconut Grove vs Coral Gables Comparison
- Pinecrest vs Coconut Grove Ultra-Luxury Comparison
- Waterfront Luxury Homes Miami & Doral Guide
- Global Network Reach: Forbes GP + Luxury Portfolio International
- Selling to International or Cash Buyers
- Free Home Valuation for Your Coral Gables Area Address
Frequently Asked Questions
Want the Sub-Market Breakdown for Your Specific Coral Gables Area Property?
Aggregate area numbers are one thing. What your specific subdivision, block, or property is doing is another. I pull the specific comp set for your address, plus access to Forbes Global Properties and Luxury Portfolio International networks for ultra-luxury tier inquiries.
Call or Text (786) 949-3971The Keyes Company · Exclusive Member of Forbes Global Properties · Founding Member of Luxury Portfolio International
15+ years · 300+ closed transactions · Bilingual EN/ES
elizabethcosta@keyes.com · Schedule a Consultation
Serving Doral, Miami, Coral Gables, Coconut Grove, and Pinecrest
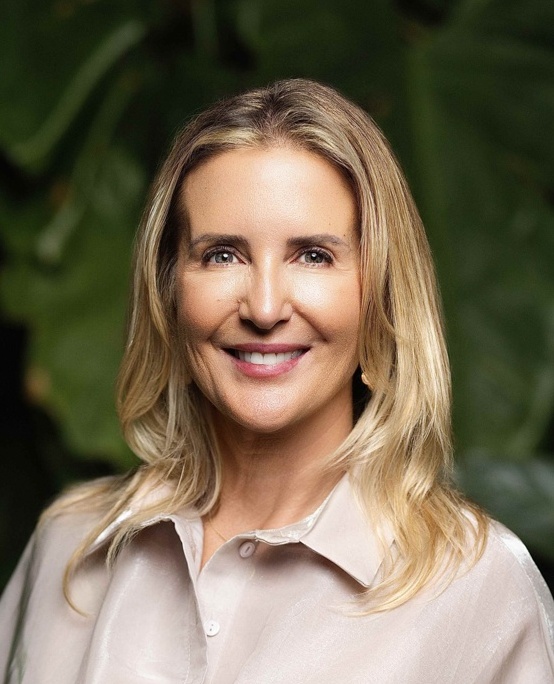 |
Elizabeth Costa, Realtor — FL Lic. #3234205 Top Real Estate Agent in Doral, Florida | The Keyes Company ☎ (786) 949-3971 ✉ elizabethcosta@keyes.com 15+ years · 300+ closed transactions · Bilingual EN/ES The Keyes Company: Exclusive Member of Forbes Global Properties · Founding Member of Luxury Portfolio International |