


By Elizabeth Costa - Top Real Estate Agent in Doral, Florida | The Keyes Company
15+ years of experience · 300+ closed transactions · Bilingual: English & Spanish
Exclusive Member of Forbes Global Properties · Founding Member of Luxury Portfolio International
What did the Doral single-family home market do in August 2026?
Across the three Doral ZIP codes (33178, 33166, 33172), 22 single-family homes closed in August 2026 at a median sale price of $925,000, up 3.4 percent from July, with median 46 days on market, 97 percent sale-to-list ratio, and 36 percent cash share (meaningfully higher than the 21 percent 90-day baseline). Over the 90-day May 5 to September 2 window, Doral aggregate closed 90 single-family homes at a median $900,000, median $454 per square foot, 39-day median days on market, 97 percent sale-to-list ratio, 21 percent cash share, 16 percent waterfront, and 2.9 months of inventory (Strong Seller conditions). Four Doral sub-markets diverged notably: 33178 (Doral Core + Doral Isles) balanced at 3.8 MOI with $900,000 median; 33166 (Downtown Doral + Miami Springs area) at 1.7 MOI (tightest) with $810,000 median; and 33172 (Fontainebleau) at 3.4 MOI with fastest 9-day DOM on small SFH sample. Top August closing reached $3,650,000 on NW 54th Doral Cir Ln in Doral Estates.
In This Report
- Doral Aggregate August 2026 Snapshot
- August 2026 Spotlight vs 90-Day Baseline
- Sub-Market Breakdown by ZIP
- Top August 2026 Doral Closings
- The Cash Share Jump: 21% to 36%
- July 2026 vs August 2026 Comparison
- What This Means for Sellers
- What This Means for Buyers
- Signals to Watch for September and Q3 Close
- Methodology and Data Sources
- Frequently Asked Questions
This report covers single-family home activity across the three Doral ZIP codes (33178, 33166, 33172) for August 2026, with 90-day rolling context from June through August and comparative reference to the July 2026 report. It uses statistically robust methodology (90 total closings analyzed), breaks the data down by sub-market, and identifies signals sellers and buyers should watch for September and Q3 close.
I am Elizabeth Costa, a Realtor with The Keyes Company. This is part of my ongoing hyperlocal market report series covering Doral, Coral Gables, Pinecrest, Coconut Grove, and other Miami-Dade markets each month.
Doral Aggregate August 2026 Snapshot
| Metric | August 2026 | 90-Day (Jun-Aug) | Direction |
|---|---|---|---|
| Closed sales | 22 | 90 | Slower month |
| Median sale price | $925,000 | $900,000 | Up slightly |
| Median $/sqft | $452 | $454 | Stable |
| Median days on market | 46 | 39 | Slightly longer |
| Median sale-to-list ratio | 97.0% | 97.0% | Stable |
| Cash share | 36% | 21% | Materially higher |
| Active inventory | 87 | 87 | Stable |
| Pending sales | 38 | 38 | Stable (growing) |
Aggregate takeaways: August closed 22 single-family Doral homes, down from June (29) and July (35) - a slower month by transaction count. Median sale price rose 3.4 percent from July. But the most notable August signal is the cash share jump from 21 percent 90-day baseline to 36 percent in August — a substantial shift toward cash buyers in Doral, which has historically been a financed-buyer market. Days-on-market lengthened slightly (46 in August vs 39 90-day median), and sale-to-list ratio held at 97 percent (unchanged). Pending sales at 38 is meaningfully higher than the typical run rate, suggesting September closed sales may accelerate.
Aggregate months of inventory (MOI) sits at 2.9, placing Doral aggregate at the top of Strong Seller's territory (under 3 months). Sub-market variation is meaningful and covered below.
August 2026 Spotlight vs 90-Day Baseline
Focusing on August 2026 specifically versus the 90-day baseline reveals three notable divergences:
- Cash share materially up (36% vs 21% baseline). August closings showed 8 of 22 cash transactions, versus the baseline 19 of 90. This is a meaningful buyer composition shift that warrants September confirmation.
- Median price up 3.4% MoM (Jul → Aug $895K to $925K). Directional but modest, within normal monthly variance for a sample this size.
- DOM slightly longer (46 vs 39 baseline). Small increase, could reflect mix effect or slight negotiation lengthening.
The 22 August closings represent a lighter volume month than June (29) and July (35). This could reflect seasonal patterns typical of late summer in Miami-Dade (many buyers travel or delay closings past summer heat/humidity), or it could reflect specific market conditions. The 38 pending sales suggest September will likely see accelerated closings.
Sub-Market Breakdown by ZIP
| Sub-Market (ZIP) | Closed 90d | Median Price | $/sqft | DOM | Cash | MOI |
|---|---|---|---|---|---|---|
| Doral Core + Isles (33178) | 45 | $900,000 | $382 | 38 | 20% | 3.8 (Balanced) |
| Downtown Doral + Miami Springs (33166) | 38 | $810,000 | $501 | 46 | 24% | 1.7 (Strong Seller) |
| Doral / Fontainebleau (33172) | 7 | $900,000 | $411 | 9 | 14% | 3.4 |
Sub-market observations:
33178 (Doral Core + Doral Isles): Highest closed count (45), largest sub-market. Median $900,000 with $/sqft $382 reflecting mix of Doral Core entry-luxury and Doral Isles gated community inventory. Balanced market at 3.8 MOI. DOM 38 days is efficient.
33166 (Downtown Doral + Miami Springs area): Strongest seller conditions at 1.7 MOI (tightest of Doral sub-markets). Highest $/sqft at $501, reflecting Downtown Doral newer construction premium. Median $810,000 reflects the mix of Downtown Doral South, Canarias, and adjacent Miami Springs older inventory.
33172 (Doral / Fontainebleau): Small SFH sample (7 closings), typical for this predominantly commercial ZIP. Median $900,000 with 9-day DOM reflects tight supply matched to specific demand pockets.
Top August 2026 Doral Closings
Top August 2026 Doral single-family closings by price:
- $3,650,000 on NW 54th Doral Cir Ln in Doral Estates (33178)
- $2,575,000 on NW 94th Doral Pl in Doral Estates (33178)
- $2,225,000 on NW 74th Ter in Doral Commons Residential (33178)
- $2,020,000 on NW 71st Ter in Doral Isles Venetia (33178)
- $1,920,000 on NW 26th St in Vanderbilt Park (33172)
Doral Estates concentration: Two of the top five Doral closings occurred in Doral Estates, reflecting this luxury-tier gated community's position at the top of Doral single-family pricing. Doral Commons and Doral Isles Venetia also contributed top-tier transactions.
All addresses referenced by street name and community per Miami-Dade MLS public data, with house numbers omitted for seller privacy post-close.
The Cash Share Jump: 21% to 36%
The most notable August 2026 signal is the cash share jump from 21 percent (90-day baseline) to 36 percent (August only). This is a meaningful shift for Doral, which historically has been a financed-buyer market. Possible explanations:
1. Higher-price-tier mix. August's higher median price ($925K vs $900K baseline) may reflect a heavier weighting of luxury tier closings ($1.5M+), where cash share is structurally higher across Miami-Dade markets due to jumbo mortgage math.
2. Delayed international buyer flow. Some international buyers who committed to purchases earlier in the year may have closed in August with cash after currency and legal-structure coordination completed.
3. Rate environment sensitivity. If jumbo mortgage rates remained elevated in August, financed buyers may have paused, leaving a cash-buyer-heavier closed pool.
4. Sample size caveat. August's 22 closings is a smaller monthly sample. A single higher-tier cash transaction has more percentage impact than in a larger monthly pool. September data will confirm whether the cash share shift is durable.
Comparison: this brings Doral's August cash share (36%) closer to Coral Gables area cash share (51-57% in comparable periods). If sustained, it suggests Doral is trending toward more cash-buyer participation, potentially reflecting continued high-net-worth buyer inflows into Miami-Dade broadly.
July 2026 vs August 2026 Comparison
| Metric | July 2026 | August 2026 | Delta |
|---|---|---|---|
| Closed sales | 35 | 22 | -37% |
| Median sale price | $895,000 | $925,000 | +3.4% |
| Sale-to-list ratio | 97.0% | 97.0% | Stable |
| Cash share | 12% | 36% | +24 pp |
Reading the comparison: Volume down (22 vs 35 in July), median price up slightly (+3.4%), sale-to-list stable, and the striking cash share shift from 12 percent in July to 36 percent in August. September data will confirm whether the cash share pattern represents a durable shift or a monthly anomaly. See the Doral Market Report July 2026 for full July context.
What This Means for Sellers
1. Cash buyer preparation matters more now. If 36 percent of Doral closings are cash, prepare your listing for cash-buyer offer flow. This means clean disclosures, no obvious appraisal risks, and readiness for 15-30 day close timelines rather than 45-60 day financed timelines.
2. Sub-market pricing strategy differs. 33166 at 1.7 MOI (Strong Seller) supports firmer pricing. 33178 at 3.8 MOI (Balanced) requires pricing to recent-closed comps rather than to top of active range.
3. 97 percent sale-to-list is favorable to sellers. Buyers are negotiating minimally (about 3 percent below asking on average) when properties are priced correctly. This is a firmer negotiation environment than a 90-92 percent SP/LP market would be.
4. Pending pipeline is strong. 38 Doral pending sales suggests September closings will accelerate. If you list now, you enter a market with active demand pipeline.
For seller strategy in this environment, see the Complete 2026 Guide to Selling Your Home in Doral & Miami pillar.
What This Means for Buyers
1. 33178 is where financed buyers have most negotiating room. 3.8 MOI at balanced market conditions. 20 percent cash share means 80 percent of the buyer pool is financed. Financed offers can compete effectively.
2. 33166 requires stronger offers. 1.7 MOI Strong Seller conditions. Higher cash share (24 percent). Faster action needed on matching properties.
3. 33172 SFH is scarce. Only 7 closings in 90 days, 5 active. If a matching property comes available, be prepared to move within days.
4. August cash share jump could pressure September competition. If cash-buyer participation continues at August rates, financed buyers may face more competition than in Doral's typical dynamic. Prepare stronger offer structure (full underwriting, shorter contingencies).
Signals to Watch for September and Q3 Close
Three signals I will be tracking in September:
Cash share persistence. Does the August 36 percent cash share hold or normalize back toward 20-25 percent? This is the single most important September signal.
Pending-to-closed conversion. Doral has 38 pending sales going into September. Typical conversion is 85-95 percent within 30-60 days. September closed count should meaningfully exceed August's 22 if pending pipeline converts normally.
Sub-market divergence stability. Is 33166 Strong Seller and 33178 Balanced pattern durable, or does inventory rebalance? Watch 33178 active inventory (currently large) versus new pending activity.
Methodology and Data Sources
Data source: Miami-Dade Multiple Listing Service (MLS), pulled September 3, 2026. Sample includes all single-family home transactions with closing dates between June 5 and September 2, 2026, in ZIP codes 33178, 33166, and 33172.
Sub-market definitions: Same convention as prior monthly reports for continuity. 33178 encompasses Doral Core (excluding Doral Isles) and Doral Isles gated master-planned community. 33166 encompasses Downtown Doral master-planned district and adjacent Miami Springs/Virginia Gardens areas. 33172 encompasses Doral Business Park zone and Fontainebleau adjacent, with structurally limited SFH inventory.
Sample size: 90 closed sales, 87 active listings, 38 pending across all three Doral ZIPs, statistically robust for aggregate and sub-market analysis. August spotlight uses 22 closings, appropriate for monthly directional signals.
Metric definitions: Median sale price = median of Sale Price for closed transactions. Median $/sqft = median of Current Price per SqFt. Median DOM = median days on market. Sale-to-list ratio = median of Sale Price divided by List Price. Cash share = percentage of closings marked "Cash" as financing type. Months of inventory (MOI) = active listings divided by (closed sales in 90 days / 3).
Address privacy: Top closings referenced by street name and community per Miami-Dade MLS public data, with house numbers omitted for seller privacy post-close.
External data references: Miami Association of Realtors statistics. Miami-Dade County Property Appraiser. Federal Reserve H.15 Selected Interest Rates.
Related Doral and Miami Research
- Doral Market Report July 2026 (prior month for month-over-month context)
- Doral Market Report Q2 2026
- Coral Gables Area Market Report August 2026 (companion Miami-Dade market)
- Downtown Doral vs Doral Isles Comparison
- Doral vs Coral Gables Comparison 2026
- Complete 2026 Guide to Selling Your Home in Doral & Miami
- Selling to International or Cash Buyers
- Global Network Reach: Forbes GP + Luxury Portfolio International
- Free Home Valuation for Your Doral Address
Frequently Asked Questions
Want the Sub-Market Breakdown for Your Specific Doral Property?
Aggregate Doral numbers are one thing. What your specific subdivision, block, or property is doing is another. I pull the specific comp set for your Doral address, plus access to Forbes Global Properties and Luxury Portfolio International networks for luxury tier inquiries.
Call or Text (786) 949-3971The Keyes Company · Exclusive Member of Forbes Global Properties · Founding Member of Luxury Portfolio International
15+ years · 300+ closed transactions · Bilingual EN/ES
4191 NW 107th Ave, Doral, FL 33178
elizabethcosta@keyes.com · Schedule a Consultation
Serving Doral, Miami, Coral Gables, and Pinecrest
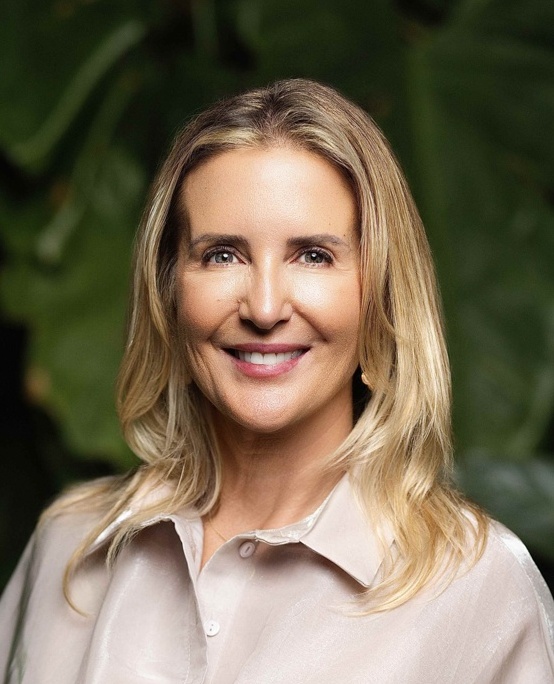 |
Elizabeth Costa, Realtor — FL Lic. #3234205 Top Real Estate Agent in Doral, Florida | The Keyes Company ☎ (786) 949-3971 ✉ elizabethcosta@keyes.com 15+ years · 300+ closed transactions · Bilingual EN/ES The Keyes Company: Exclusive Member of Forbes Global Properties · Founding Member of Luxury Portfolio International |